3D Terrain — Take your mapping projects to new heights
Are you ready to take your map animations to a whole new level? Get ready to elevate your mapping projects with our new groundbreaking feature: the 3D Terrain data layer. With this newest release, you can delve deep into valleys, soar over mountains, and really bring your maps to life. In this blog post, we’ll take you through the possibilities that this feature offers and show you how you can become the art director of your own map, giving you control over almost every aspect of the terrain visualization.
Explore the Elevation
With the 3D Terrain feature, you can take your viewers or reader on a virtual tour of the world’s most impressive landscapes. Start dipping into deep valleys, and showcase every little detail or fly over the highest mountains! This feature allows you to visualize elevation data like never before, creating beautiful and informing maps that helps your viewers or readers to see things in perspective.
Tilting Your Map View
To enhance your experience further, Mapcreator offers the option to tilt your map view. By tilting the map, you can gain a better understanding of the terrain’s elevation and how it affects the landscape. This adds depth and realism to your maps, making them more engaging and informative. Simply right-click your mouse and hold the press as you drag the mouse around, or type in your value in the ”tilt” section in the top bar.
How we manage to put things into perspective!
If you look at a map with traditional hillshading, you’ll be able to tell where the mountains are, but you have no idea how tall they are. Here’s a good test: try finding the tallest peak on the image below. It’s impossible! It makes sense, since traditional hillshading only reflects how steep a place is, but does nothing to show how high that place is.
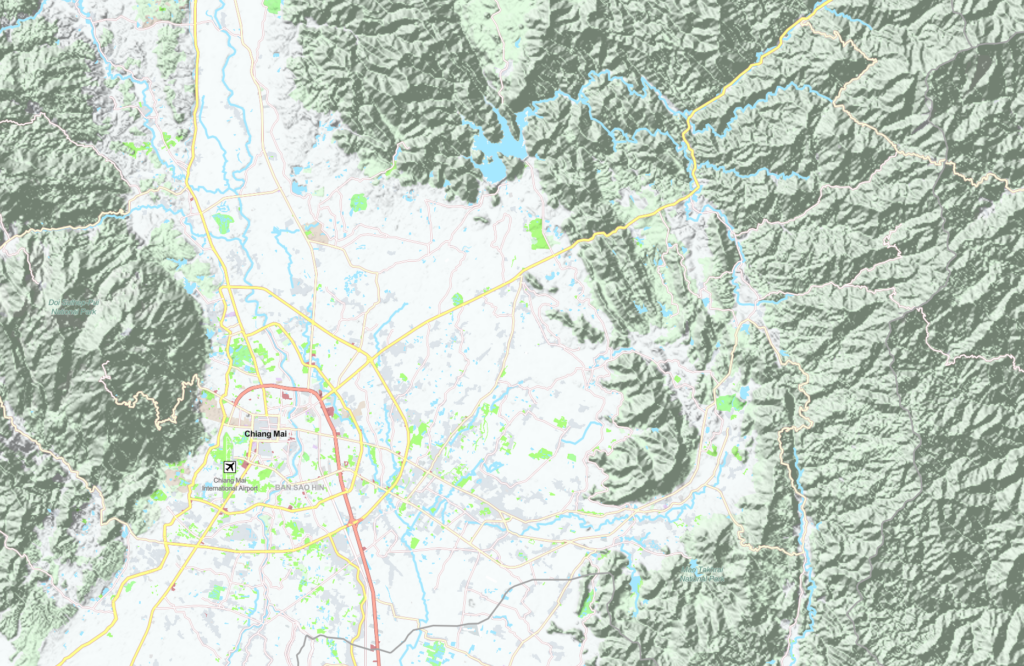
To solve this problem, we added another layer where every pixel is colored based on its elevation. Usually the colors go from green for the lowest areas to dark-brown for the highest area.
This technique has a problem on its own: if your color scale covers the entire range of elevations on Earth (~0m to ~8849m), it will only work well on low zoom levels where the entire world is in view. However, if you zoom into somewhere like Belgium where the tallest hill is only 694m, every pixel will have almost the same green color and you won’t see those smaller changes in elevation at all.
Here’s where the novelty of our solution comes into play: we came up with some smart logic that readjusts the color scale every time you move the map. It’s fast enough to run in the background, resulting in a very smooth map browsing experience. The result is a very detailed representation of terrain in any place of the earth. You can now see both the full range of elevations when zoomed out and the tiniest detail when zoomed in.
Layer it up! Combine data layers
The magic doesn’t stop there! Did you know that all of our data layers can be layered and combined? Simply select multiple layers from the data layers menu and drag them in the elements list to determine the order of which they are stacked. Below we have a great example on how our 3D terrain layer is combined with the Russo Ukraine War data layer.
Try it out for yourself
The 3D Terrain data layer is just a few clicks away. Navigate to the “Topography” section of the Data Layers submenu in the Mapcreator tool and you’ll discover this new addition waiting for you. Once you select it, you’ll instantly have access to a world of elevation data that will transform your maps into immersive landscapes. So, if you’re ready to elevate your mapping game, look no further than our 3D Terrain feature!
Don't forget to share this post!
Deeper understanding of maps
For mapping tips, updates, and deep dives for the cartographically curious.
Choropleth maps in Mapcreator just got easier
A choropleth map is a color-coded map that shows how values differ between geographic areas, such as countries, regions, or...
Read more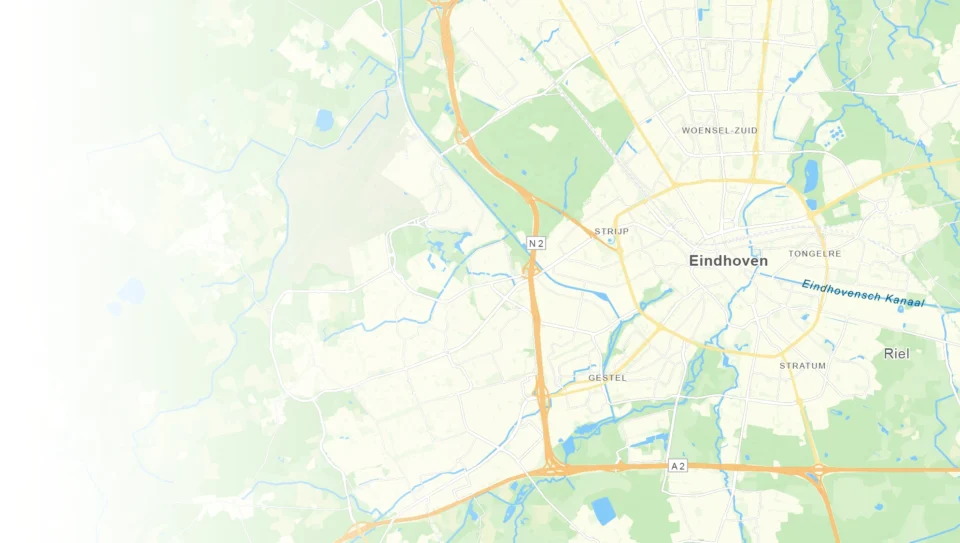
We just do maps. And that’s the point.
A good map often looks effortless, and that’s the whole point. But behind that simplicity are countless cartographic choices, design...
Read more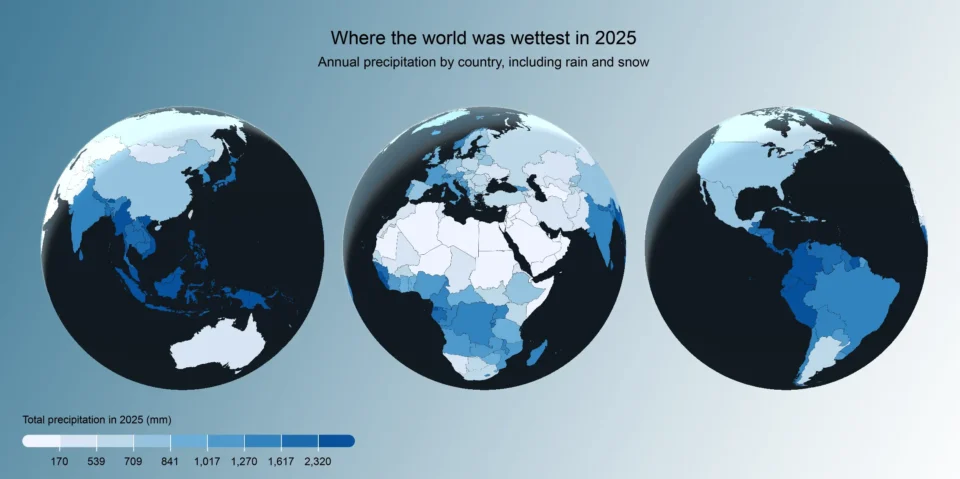
Why bringing your own data can make for better maps
Some maps do not begin as maps. They begin as bits and pieces of information waiting to make sense together....
Read more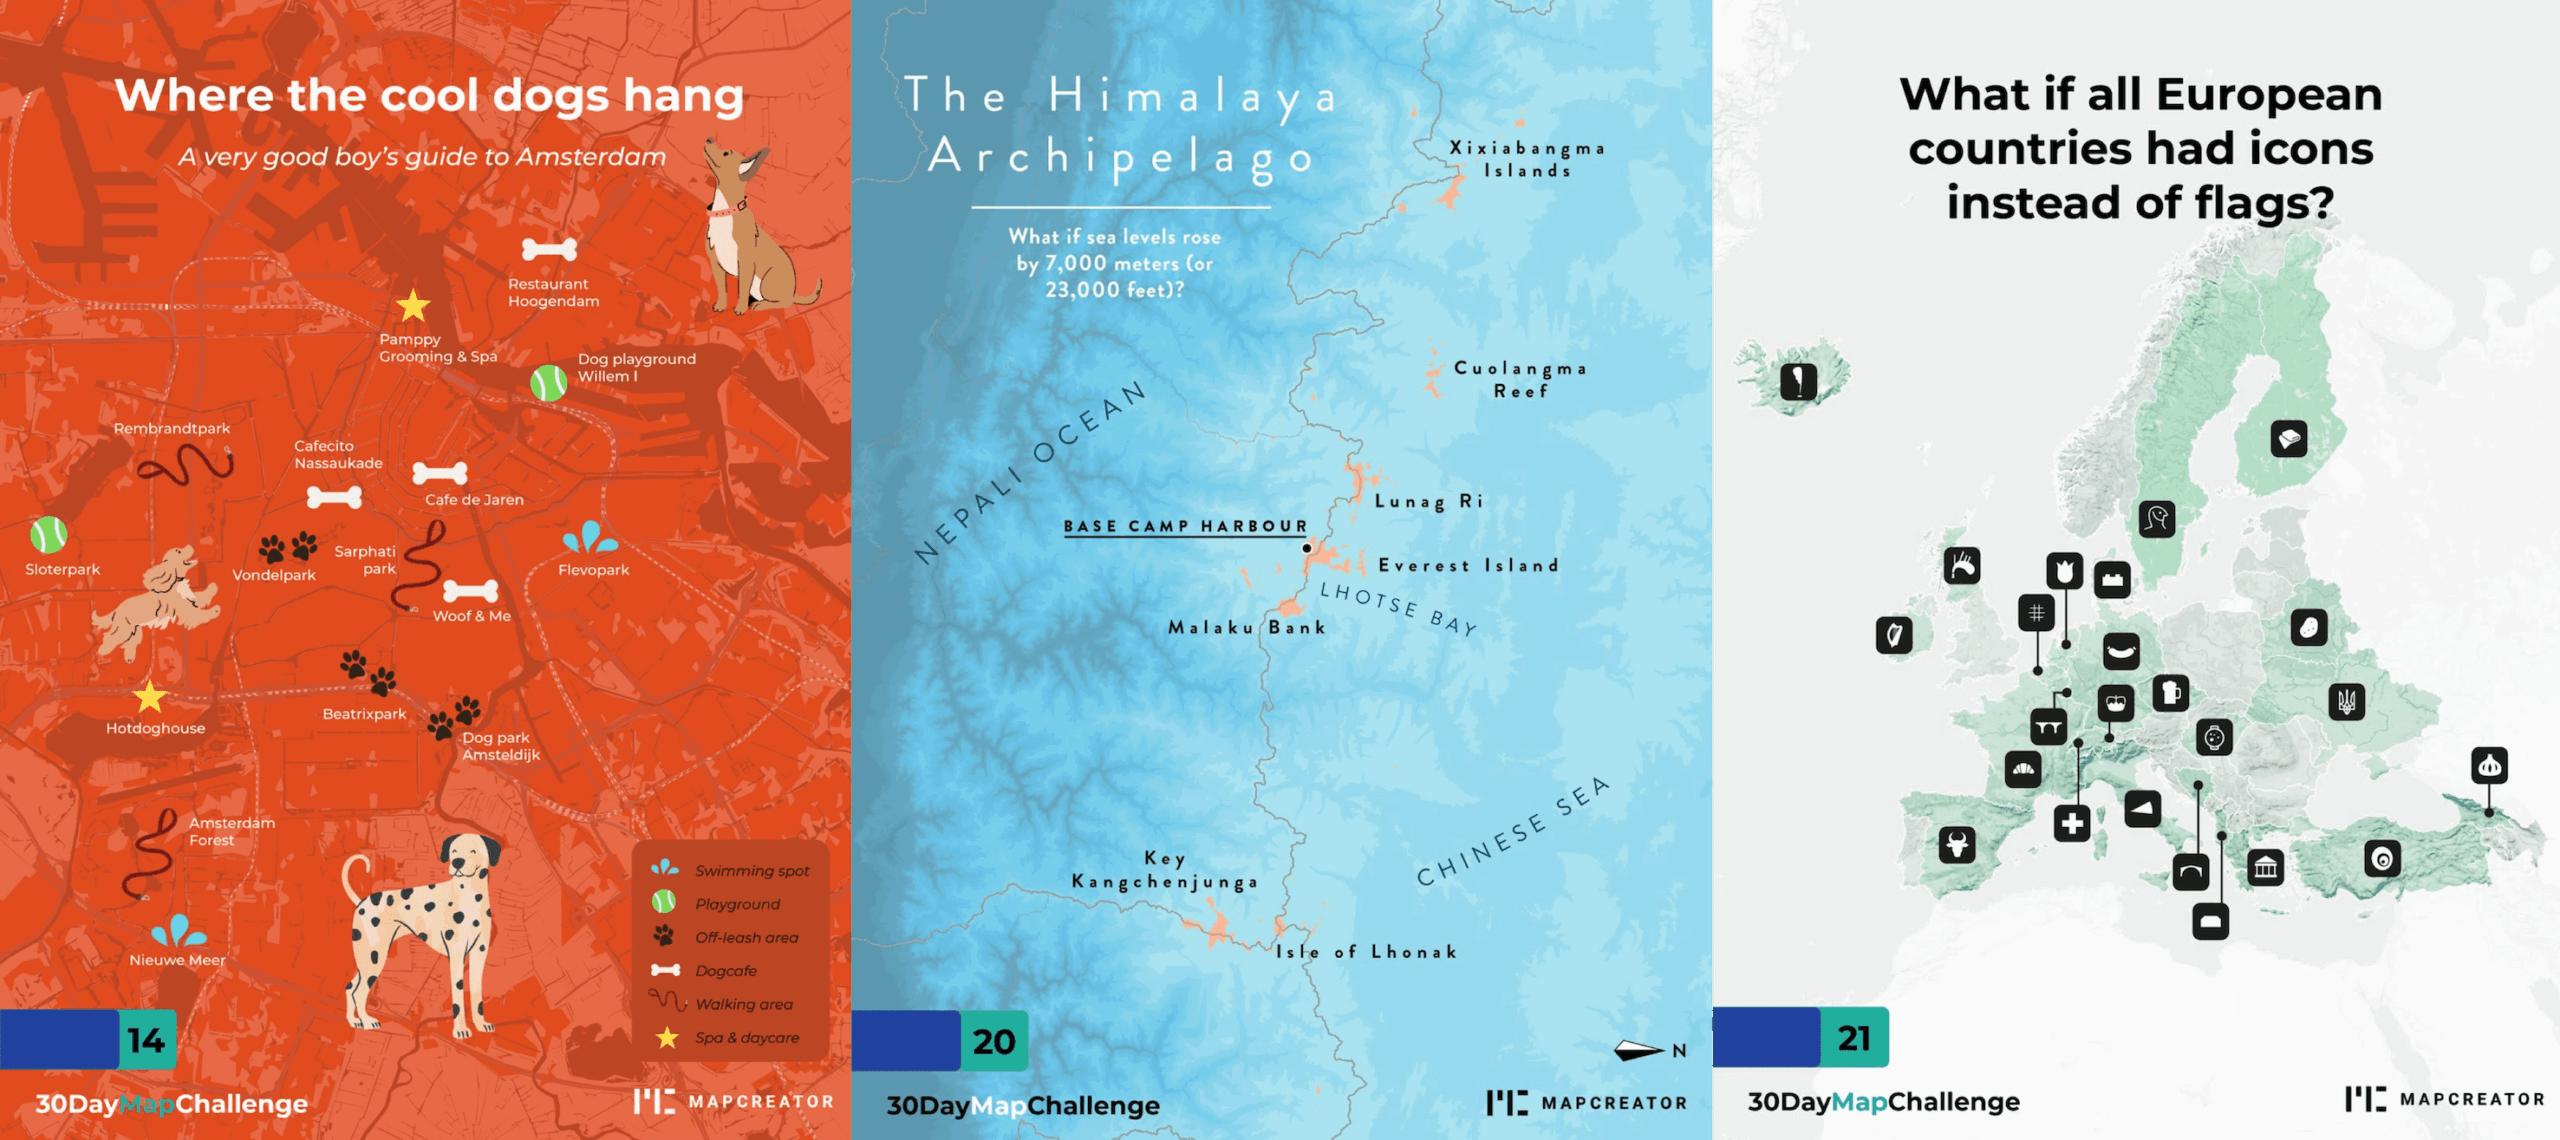
What the 30 Day Map Challenge taught us about creativity (and Mapcreator)
Every November, cartographers, designers, and data nerds gather around the same global campfire: the 30 Day Map Challenge. The rules...
Read more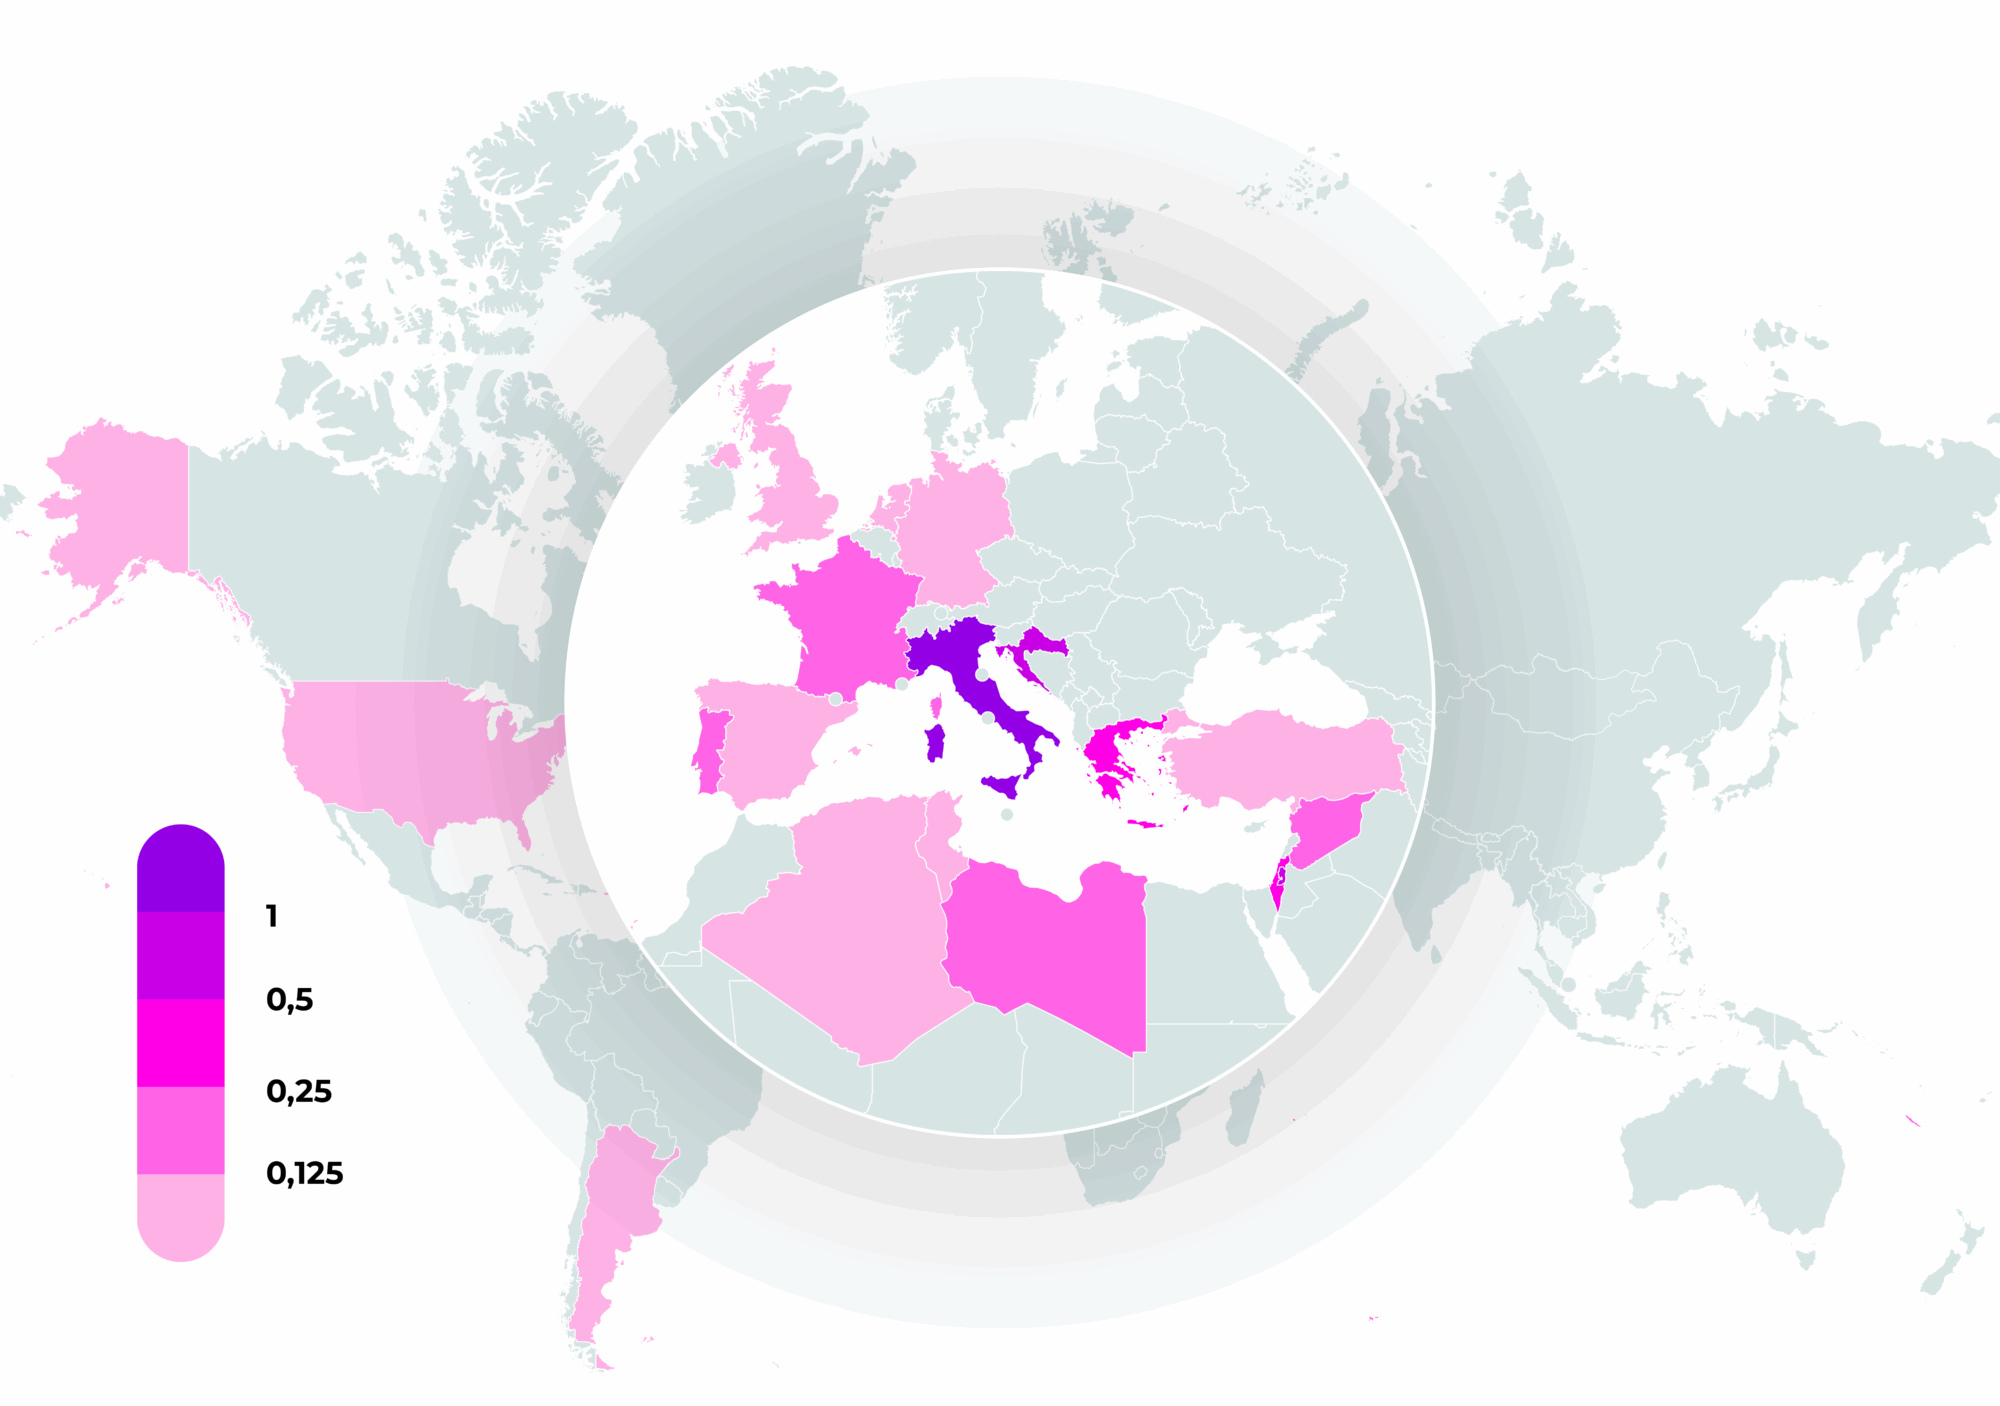
How static, interactive, and animated maps win hearts (and clicks)
There’s a lot of competition for attention out there. Cat videos, doomscrolling, the latest season of [enter your favorite season...
Read more
Your 2026 Winter Olympics maps are here!
Italy is getting ready for the 2026 Winter Olympics. Snow, ice, roaring crowds, and at least one person asking if...
Read more