Clarity when it matters most
Mapcreator helps organizations assess risks, track assets, and communicate clearly during critical events. Create detailed maps that display routes, incidents, infrastructure, and resources — so your teams can act fast and stay aligned when every second counts.
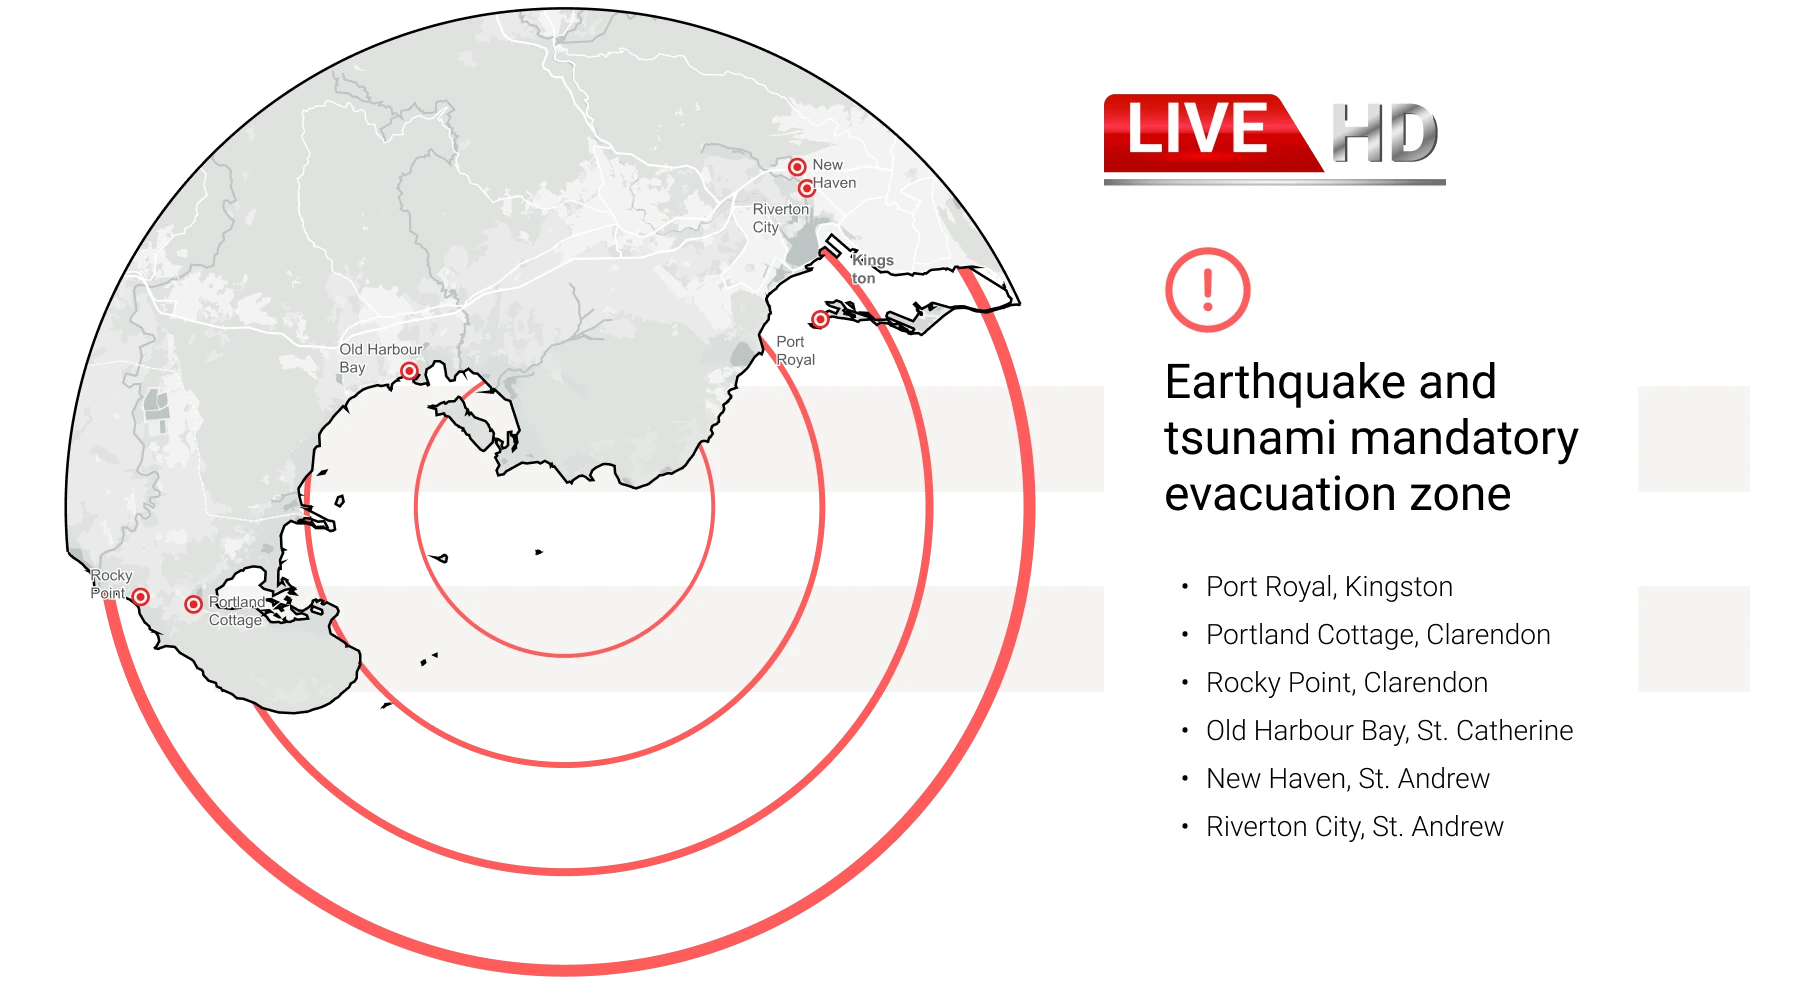

Visualize risks and vulnerabilities
Import and map data from spreadsheets or use Mapcreator’s live feeds to identify potential risks and hotspots. Highlight zones of concern, supply routes and pipelines, or operational boundaries with precise polygons and annotations. From natural disasters to supply chain disruptions, Mapcreator gives you the clarity to respond quickly and confidently.
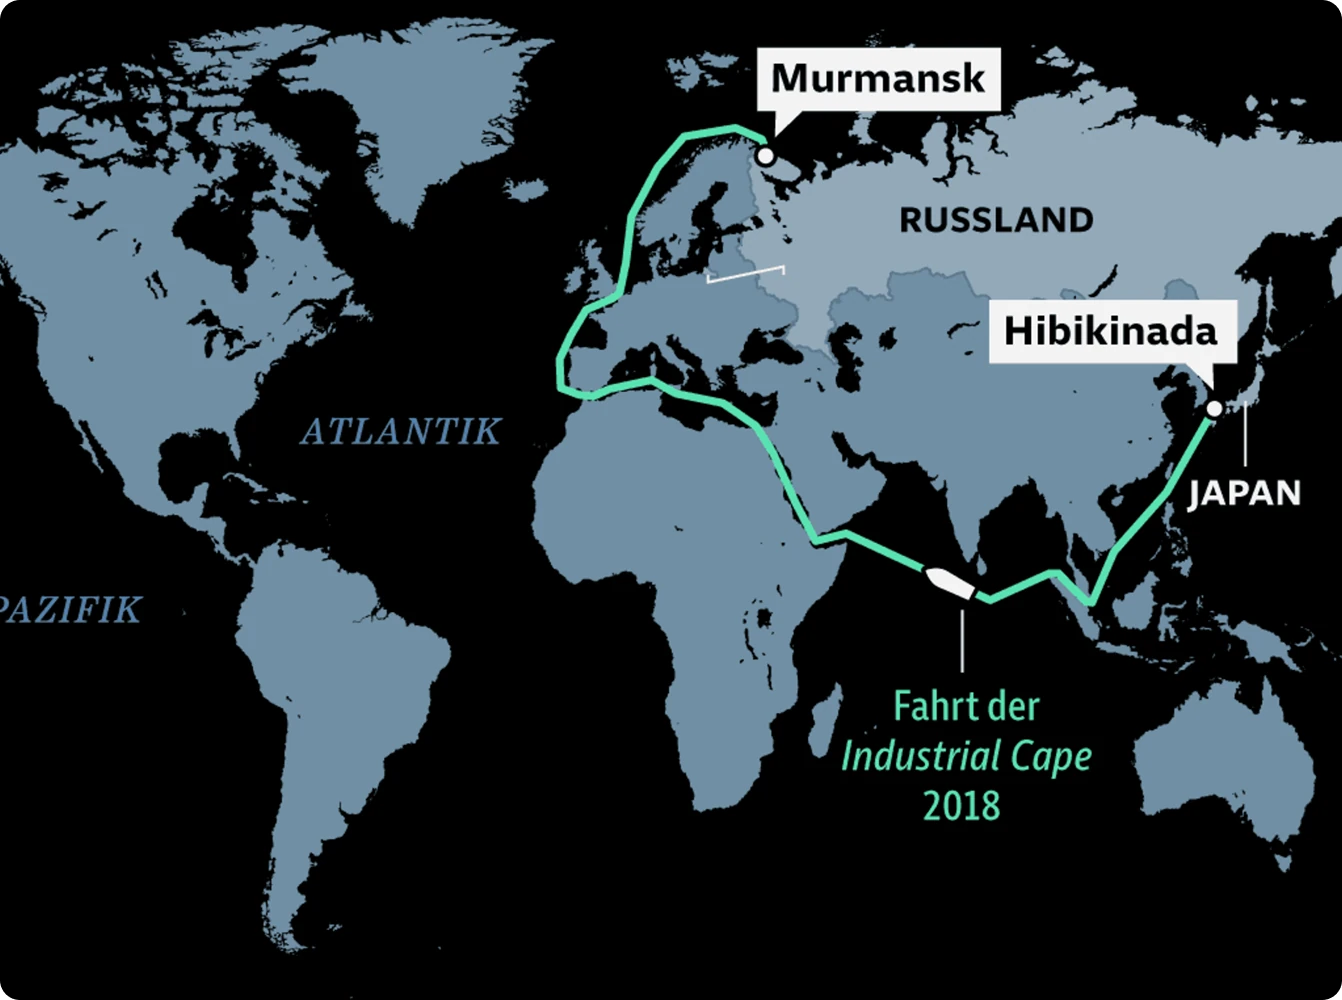
Plan and coordinate logistics operations
Plot transportation corridors, delivery zones, or evacuation routes with pinpoint accuracy.
Use color-coding to highlight risk levels or traffic density, and visualize routes dynamically with animations that trace the movement of goods, vehicles, or personnel.
Communicate securely across teams
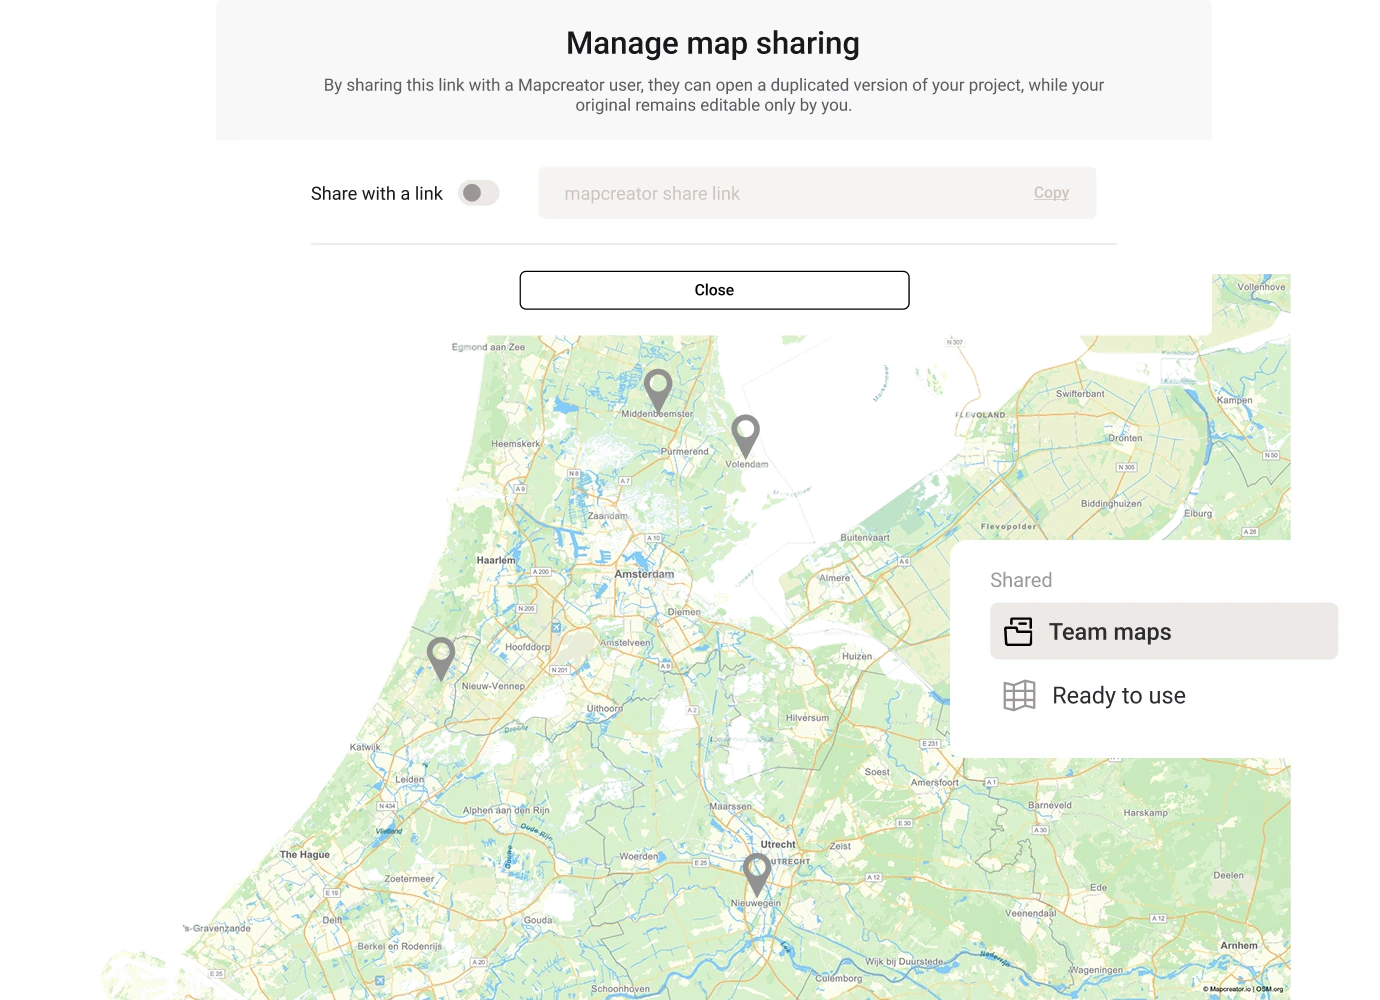
Distribute secure, interactive maps internally for coordination, or export static versions for reports and briefings. Embed maps on protected portals or share as SVG, PNG, or PDF CMYK for high-resolution printouts. Whether it’s daily logistics or crisis management, your visuals stay consistent, accurate, and confidential.
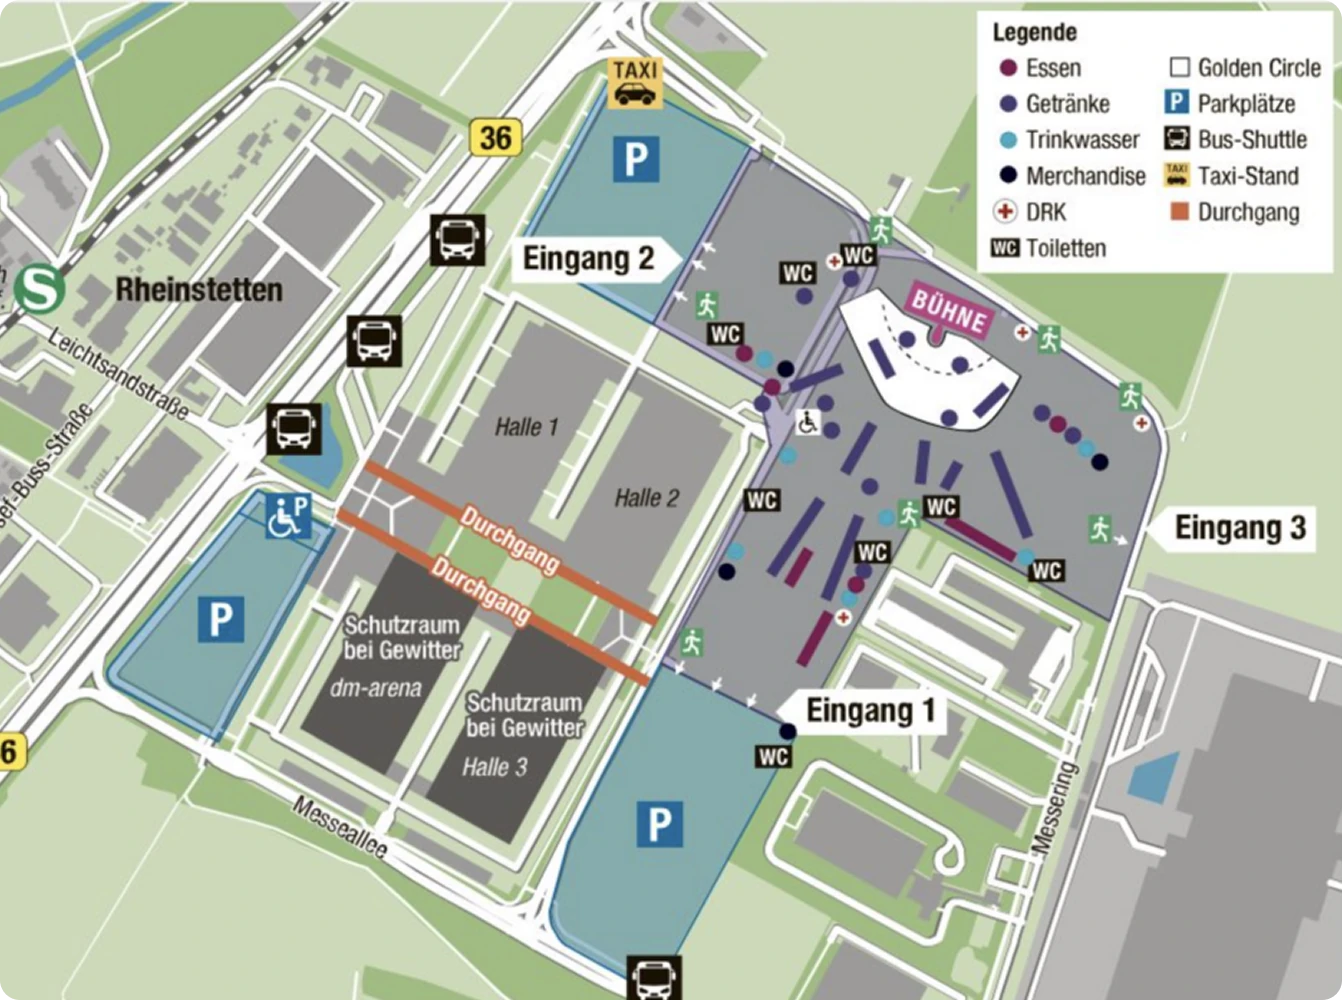
Simplify complex information
Present complex data in an intuitive, easy-to-read format. Use Mapcreator’s no-code interface to create clean, standardized maps that make even the most complicated scenarios easy to understand. Trust Mapcreator’s data sources to display disputed areas and highlight areas of concern according to your team’s world views.
Why risk and logistics teams trust Mapcreator
Mapcreator helps you anticipate, manage and visualize risks with professional-grade maps that keep everyone informed and aligned. From logistics planning to crisis response, your maps provide the context that drives confident decisions.

Map smarter now.
No spam, just high-quality mapping insights. Unsubscribe anytime.
Frequently asked questions
Got a question? Start with these essential FAQs, or explore our Knowledge Base for more Mapcreator guidance.
Which Mapcreator setup is best for risk management teams?
The right setup depends on your team size, data needs, map types, and level of customization. You can try Mapcreator for free to explore the tool. Enterprise pricing is tailored around users, static, interactive or animated maps, custom data sources, integrations, and custom map styles. Mapcreator does not charge based on the number of maps created. Get in touch for a custom quote.
Can we combine our own risk data with external map layers?
Yes. You can import your own asset, incident, route, infrastructure, or other data and combine it with contextual map layers. This helps teams visualize affected areas, risk exposure, vulnerable locations, supply routes, service regions, or operational boundaries on a single clear map.
Can Mapcreator support during fast-changing situations?
Yes. Mapcreator supports live data layers for events such as hurricanes, earthquakes, wildfires, drought, fire danger, elections, and other location-based developments. These layers help teams monitor changing conditions and communicate updates with clearer geographic context.
Can we create maps for reports, briefings, and internal dashboards?
Yes. You can export static maps for reports and presentations, create interactive maps for internal portals, or use animated maps to explain movement, timing, and changing conditions. This makes the same map content useful across planning, response, and stakeholder communication.
Is Mapcreator only for risk management teams?
No. Mapcreator is used across industries including newsrooms, broadcast, real estate, tourism, government, and marketing. That makes it useful for organizations where risk, communications, operations, and public-facing teams all need consistent map visuals.