Maps that move your stories
Broadcast maps need to be fast, accurate, and ready for every screen. Built on decades of cartographic experience, Mapcreator focuses entirely on maps so teams can design, animate, and export on-air visuals without post-production headaches or internal bottlenecks.

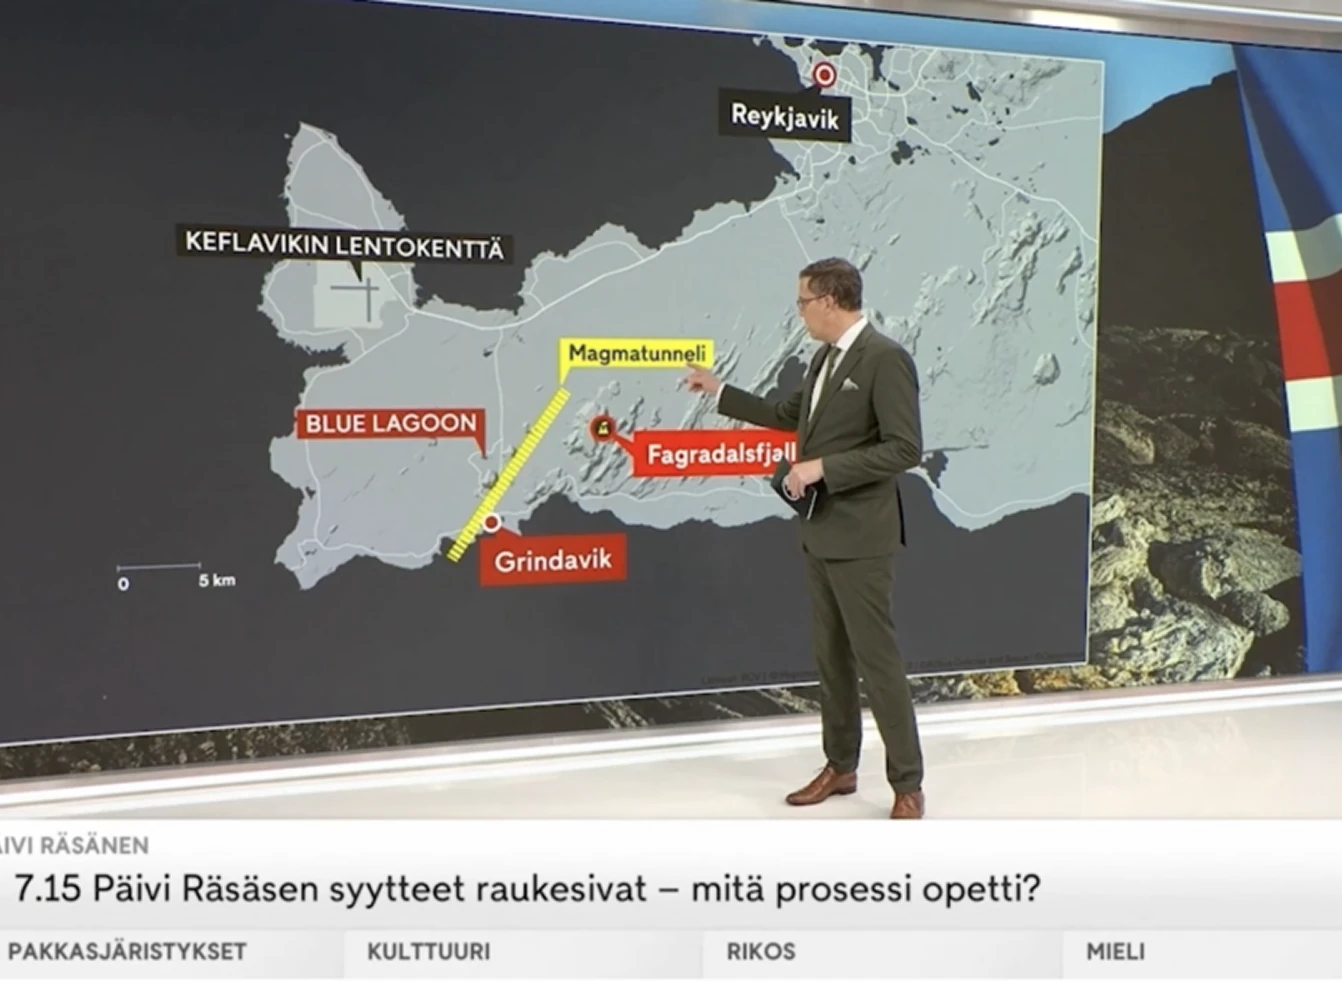
Bring your stories to life with animations
Highlight routes or key locations with Auto-keyframe, our animation shortcut that automatically generates smooth camera movements along your line or route. Adjust zoom, tilt, or rotation with a few clicks — the camera does the rest. Mapcreator turns data into broadcast-ready motion graphics effortlessly.
Fast visuals, ready for air
Mapcreator’s intuitive interface lets anyone on your team create ready-to-air maps in minutes. Stay ahead of the story with tools built for broadcast speed. From automatic animations to live-data layers. Export your maps in various formats, including iframes for digital maps, SVG, JPG, PNG and MP4, MOV or image sequence for map animations. Provide your viewers with the latest information in the best possible quality, with animation resolutions from Full-HD to 4k.

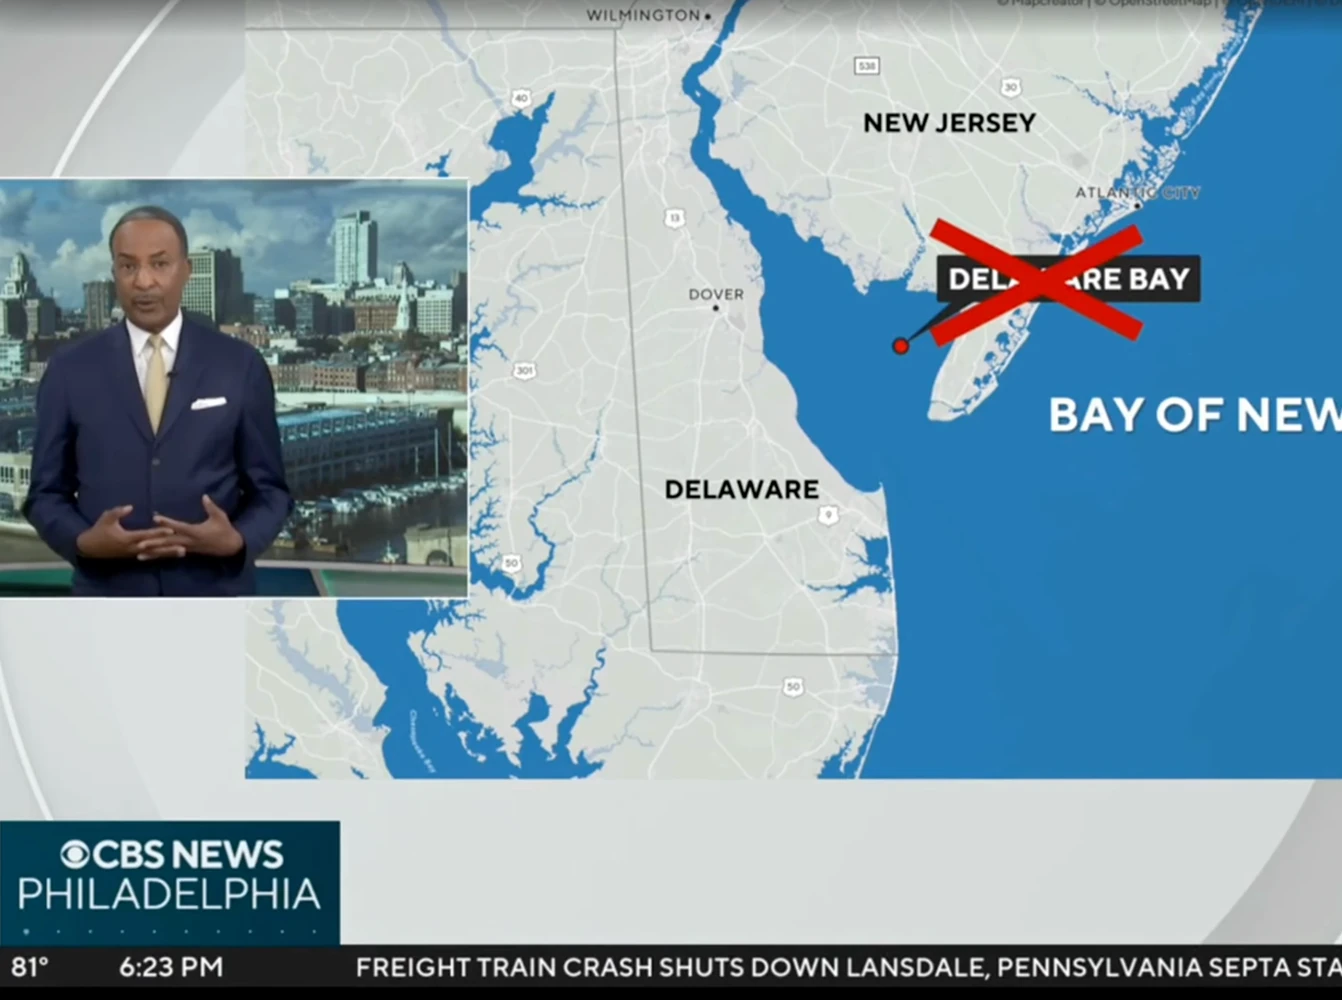
Custom maps, on-brand and on time
Use your fonts, colors, icons, and text boxes to create professional, recognizable maps. Ensure that important on-screen text and graphics are visible with your own title-safe settings. Maintain your visual identity and stay in control of how your maps appear on every platform.
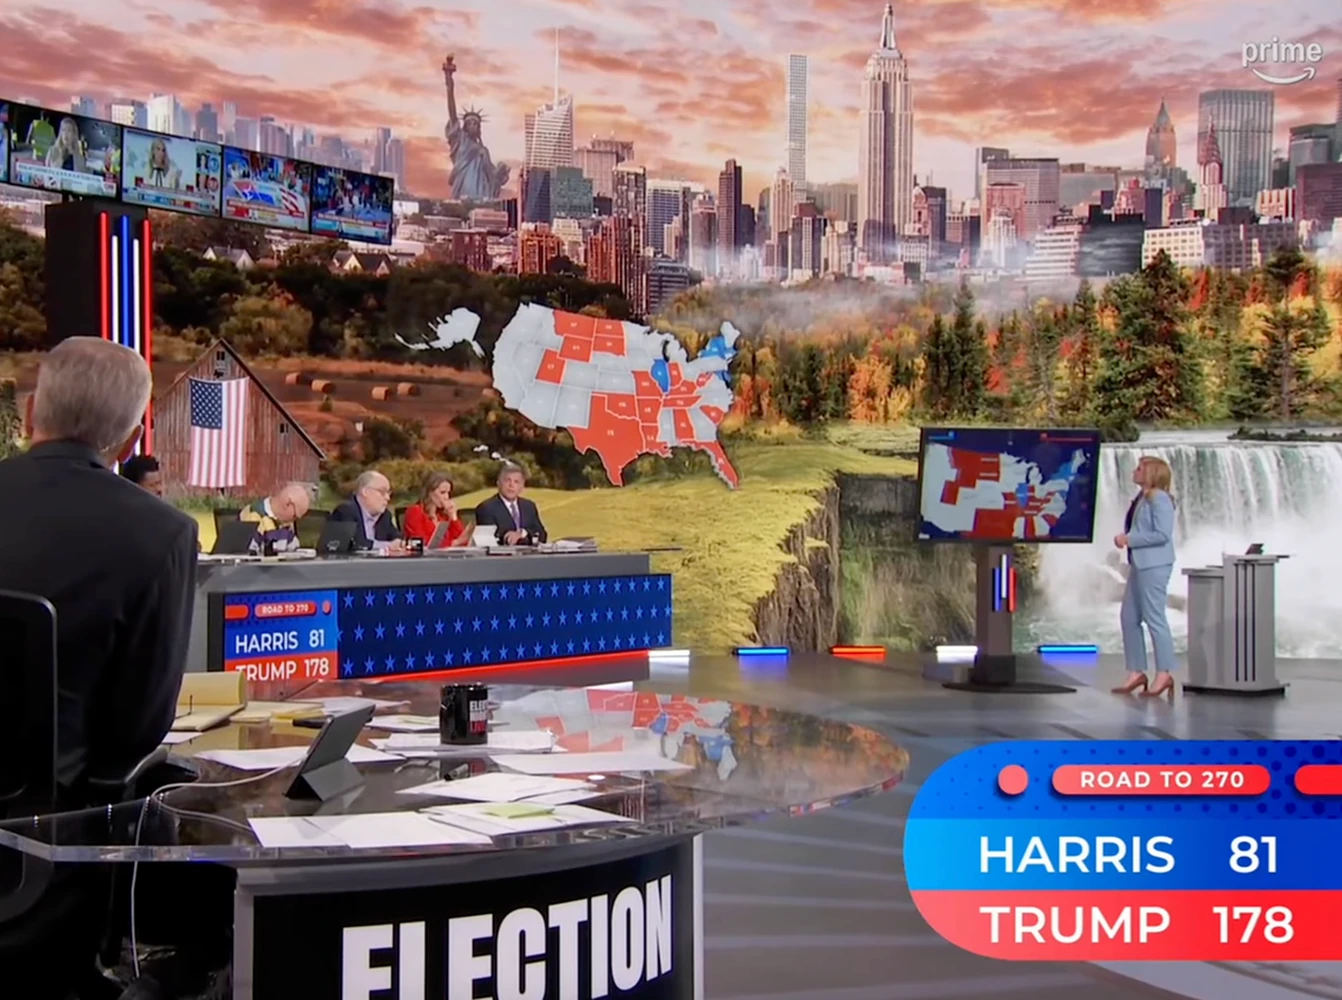
Real-time data, real-time context
Add live data layers such as earthquakes, hurricanes, US and Canadian wildfires, the Ukraine war, North American drought conditions, and Fire Danger in Canada. Or connect to reliable election feeds from trusted partners. These layers update continuously, ensuring your maps reflect what’s happening in real time.
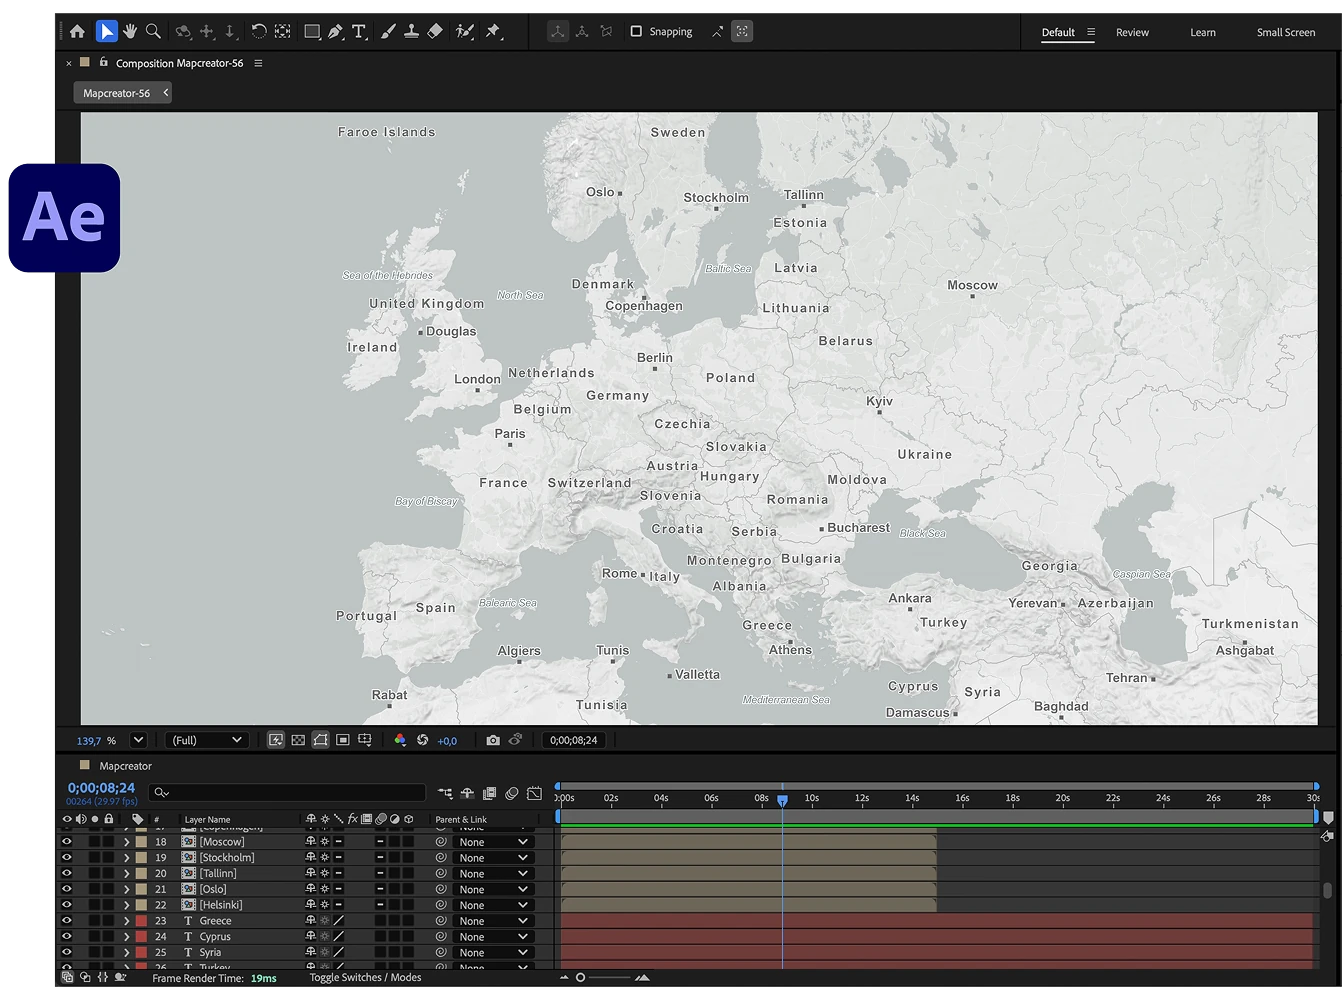
Adobe After Effects extension
Cut corners without cutting quality. Mapcreator’s Adobe After Effects extension lets you create and customize map animations inside your existing workflow. This means no exporting or switching tools. Start with pre-defined animation templates, load your styles automatically, and adjust everything in real time.
Seamless newsroom integration
Bring mapping into your existing newsroom or playback workflow. Mapcreator doesn’t replace the tools you already use; it makes the map-making part faster, smoother, and easier to integrate. With support for Adobe After Effects, GEOlayers, and more, you can go from data to air without switching tools.
Map smarter now.
No spam, just high-quality mapping insights. Unsubscribe anytime.
Frequently asked questions
Got a question? Start with these essential FAQs, or explore our Knowledge Base for more Mapcreator guidance.
Which pricing setup is best for broadcast teams?
The right setup depends on your team size, production workflow, map types, and level of customization. You can try Mapcreator for free to explore the tool. Enterprise pricing is tailored around users, animation features, video exports, cloud rendering, OGraf-compatible workflows, Adobe extensions and custom map styles. Mapcreator does not charge based on the number of maps created. Get in touch for a custom quote.
Can we create maps quickly enough for live or same-day production?
Yes. Mapcreator helps broadcast teams create consistent map graphics quickly using approved styles, templates, and export settings. Producers, journalists, designers, and graphics teams can create maps without starting from scratch every time.
Can Mapcreator support both rendered videos and real-time playback?
Yes. Mapcreator can support server-rendered map videos, where the video is rendered in the cloud and stays on the server for frictionless workflow management. For workflows that do not need a video file at all, Mapcreator also supports real-time rendered maps.
Can Mapcreator fit into advanced broadcast graphics workflows?
Yes. For advanced production setups, Mapcreator supports OGraf-compatible animated maps for real-time broadcast graphics. This helps teams bring branded, data-driven map animations into live or automated broadcast environments.
What can we export for on-air, digital, and social use?
You can export maps as MP4, MOV, image sequences, SVG, PNG, JPG, or iframe embeds. Animations can be rendered from Full HD to 4K, so teams can use the same map workflow for on-air graphics, online stories, social clips, and newsroom publishing.