


POV: Should have been a static map
Interactive maps are powerful. They let readers zoom, pan, click, explore, and discover details at their own pace. But not every map needs to be interactive, just because it can. Hear us out.
In many publishing workflows, especially for newsrooms, marketing teams, government communications, and corporate websites, the goal is simple: place a polished map inside an article, report, landing page, or story, and make sure it looks great everywhere. But have you ever wondered why all these embedded online maps look the same? And why does this random Café keep on popping up on this Google map? (Nothing against the café. We’re sure the coffee is lovely. It just wasn’t invited to this particular story….)
Interactivity comes with a cost, from production time and performance to the effort required from the reader. For an audience looking to understand a story quickly, sometimes a couple of well-designed static maps simply do the job better.
“Interaction should be an enhancement, not a requirement.”
— Axis Maps
That is where static map embedding becomes incredibly valuable.
Instead of embedding a live map from a third-party service, you publish the map as a static file, using an optimized image, SVG, or a combination of both, inside clean responsive HTML. The result is fast, reliable, portable, and fully under your control. Also, it doesn’t look like all the other Google Maps out there, either.
But, most importantly: you own the output.
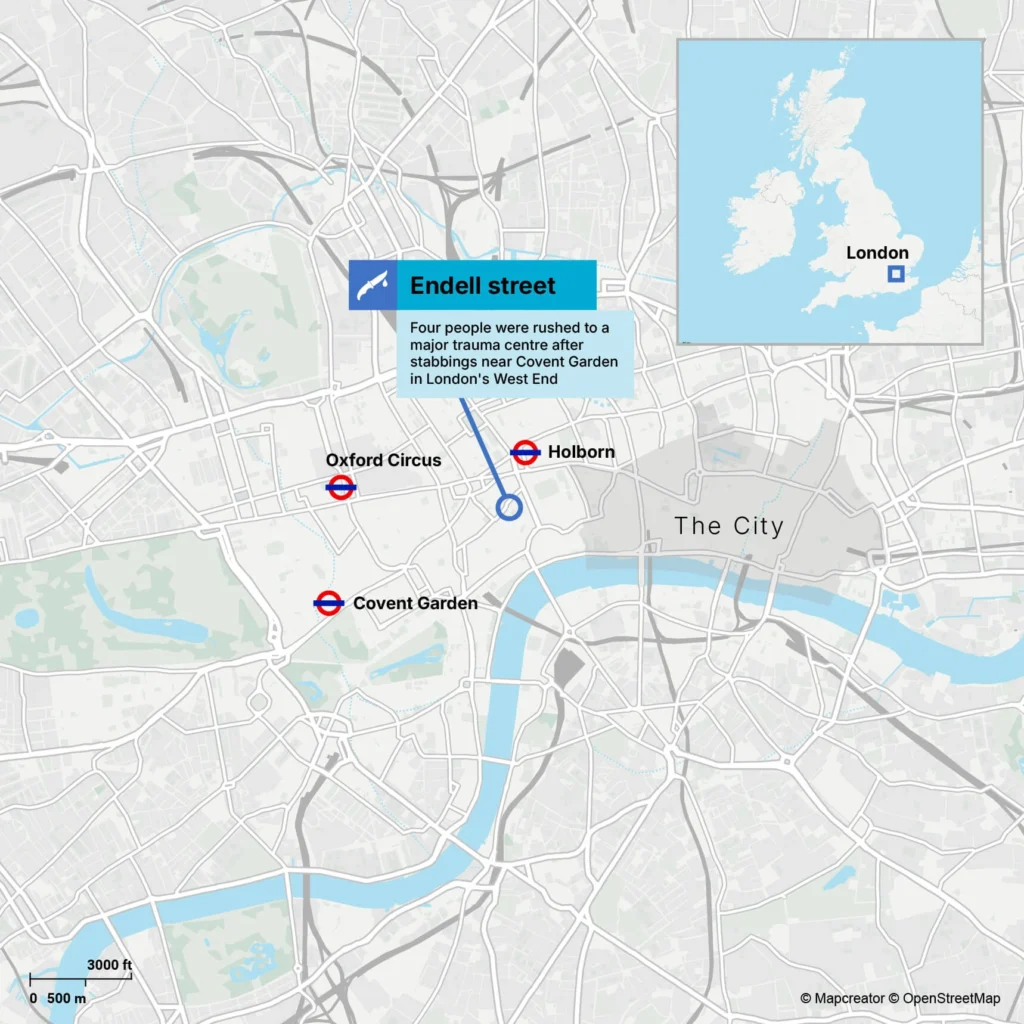
The problem with third-party embeds
Most online map and chart tools make publishing easy by giving you an embed code. You copy a script or iframe, paste it into your CMS, and the map appears on your website. That is convenient, but it comes with a long-term trade-off.
When your published content depends on a third-party embed, your website is not truly self-contained. The map still depends on someone else’s servers, scripts, APIs, styling, uptime, pricing, and product roadmap.
And there is another kind of control involved: what actually appears on the map. As The New York Times has pointed out, widely used digital maps are shaped by commercial and other interests, from promoted businesses to decisions about place names and borders. In other words, that random café didn’t necessarily wander onto your map by accident.
“It is very easy to change digital maps and to do it without anyone really noticing.”
If the service changes its embed format, removes features, updates branding, changes its pricing, slows down, blocks access, or even disappears, your published content can break or degrade. Even if the map still works, you may need to keep paying for a platform just because your archive depends on it. For publishers, this can become a hidden and pricey form of vendor lock-in.
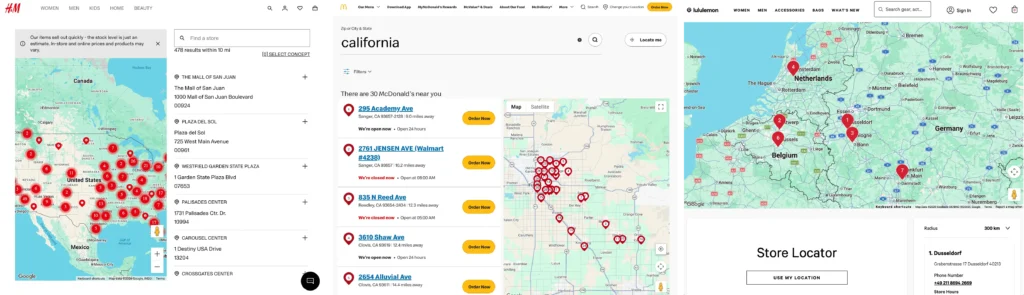
Take a look at the three maps above. They come from H&M, McDonald’s and lululemon, three very different global brands, yet the maps themselves are almost indistinguishable. Different companies, different identities, same familiar map.
Static embeds give you ownership
A static map export works differently.
The map is rendered into an image format and then embedded directly into your website. Once published, the map behaves like any other media asset on your site. You can store it on your own CDN, include it in your static site export, cache it aggressively, archive it, move it, version it, or republish it later.
Static doesn’t have to mean set in stone, either. With Mapcreator’s static image embeds, the published URL stays the same, so the graphic behind it can still be updated without having to replace the embed on every page.
That makes static embeds particularly useful for fast-moving stories. A breaking-news map can be published quickly, updated as the situation develops, and stay responsive, without bringing along the overhead of a fully interactive map. Less machinery, same destination.
That makes static embedding especially useful for:
- article maps
- locator maps
- election result maps
- choropleths
- print-style graphics
- evergreen explainers
- annual reports
- pages that need to remain stable for years
For many publishing use cases, the map is not an application. It is part of the story. Static embedding treats it that way, and we’re here to support this cause.
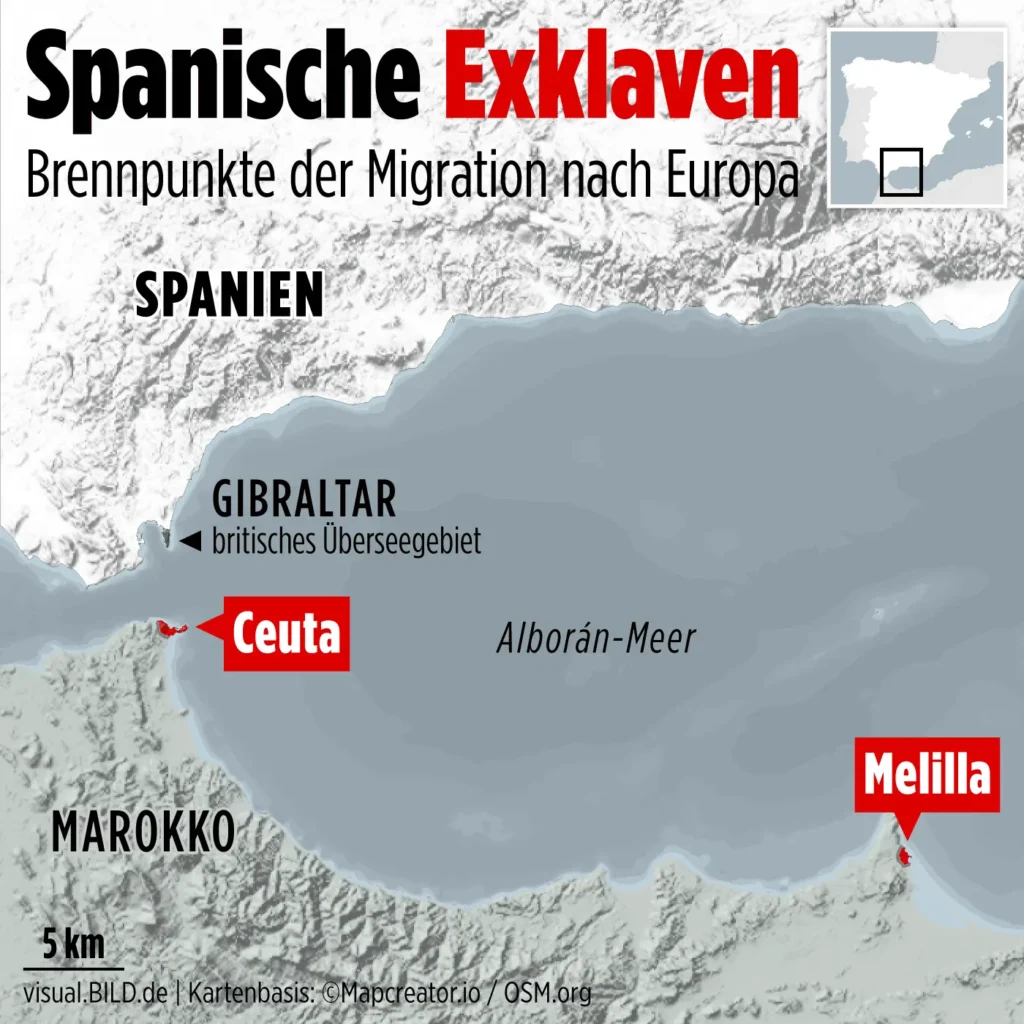
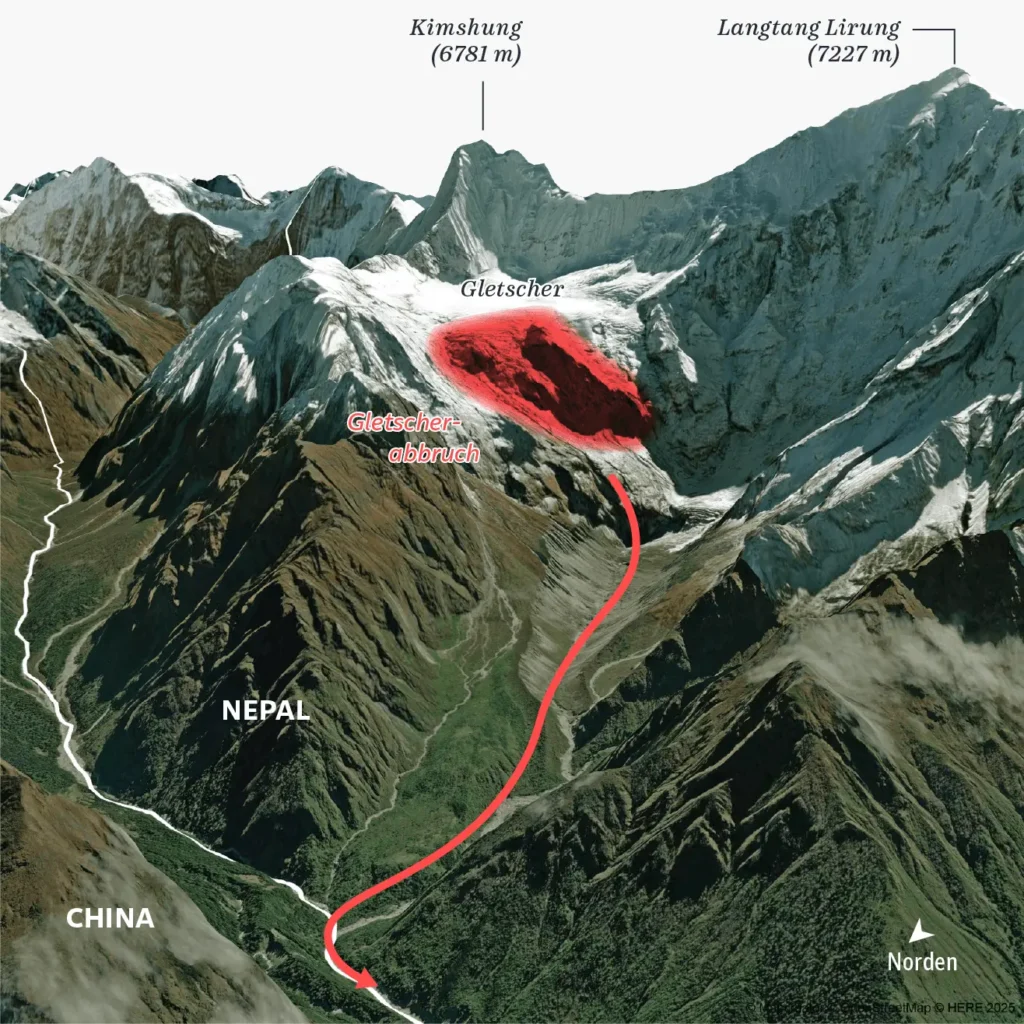
Static does not mean less professional
There is a tendency to think that interactive equals advanced, and static equals basic. In practice, that is not always true. We made the case for not forgetting static maps back in 2023, and three years later, we’re doubling down.
A well-designed static map can be clearer, faster, more accessible, and more stable than an interactive embed.
For readers, the best map is often the one that immediately communicates the point. If the story is about where something happened, how regions compare, or what changed over time, a carefully designed static map may be exactly right.
Static maps are also easier to use in editorial workflows. They can be reviewed, approved, exported, archived, and published like any other visual asset. That makes them especially practical for teams that care about reliability, consistency and long-term control.
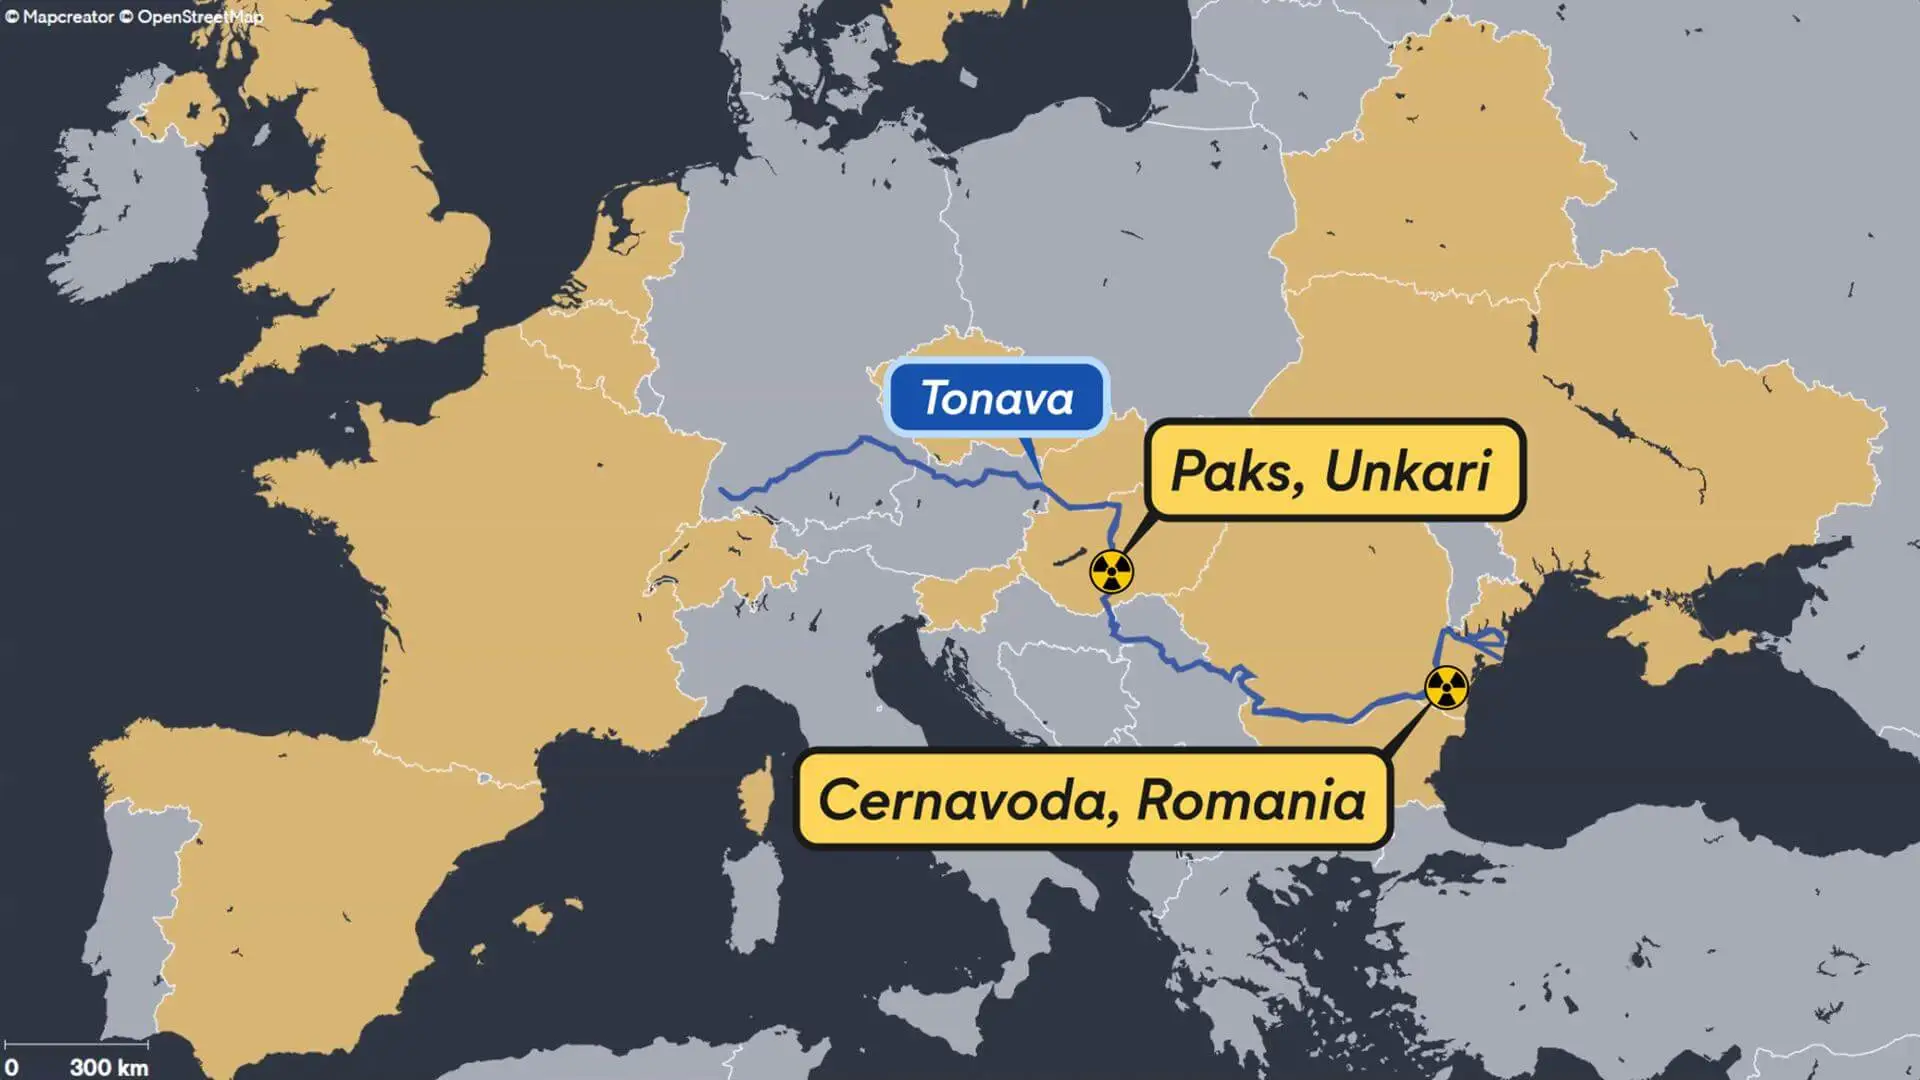
Better performance, fewer dependencies
There is no need for a third-party runtime or external JavaScript. There is no iframe that needs to resize correctly. There are fewer privacy, tracking, security, and content-blocking concerns.
If all the reasons above don’t suffice yet, here’s the gist. For website owners, that means:
- faster page loads
- fewer external requests
- better caching
- simpler static site exports
- more predictable rendering
- fewer things that can break later
This is especially important for high-traffic news articles, long-term archives, and pages that need to perform well on mobile networks.
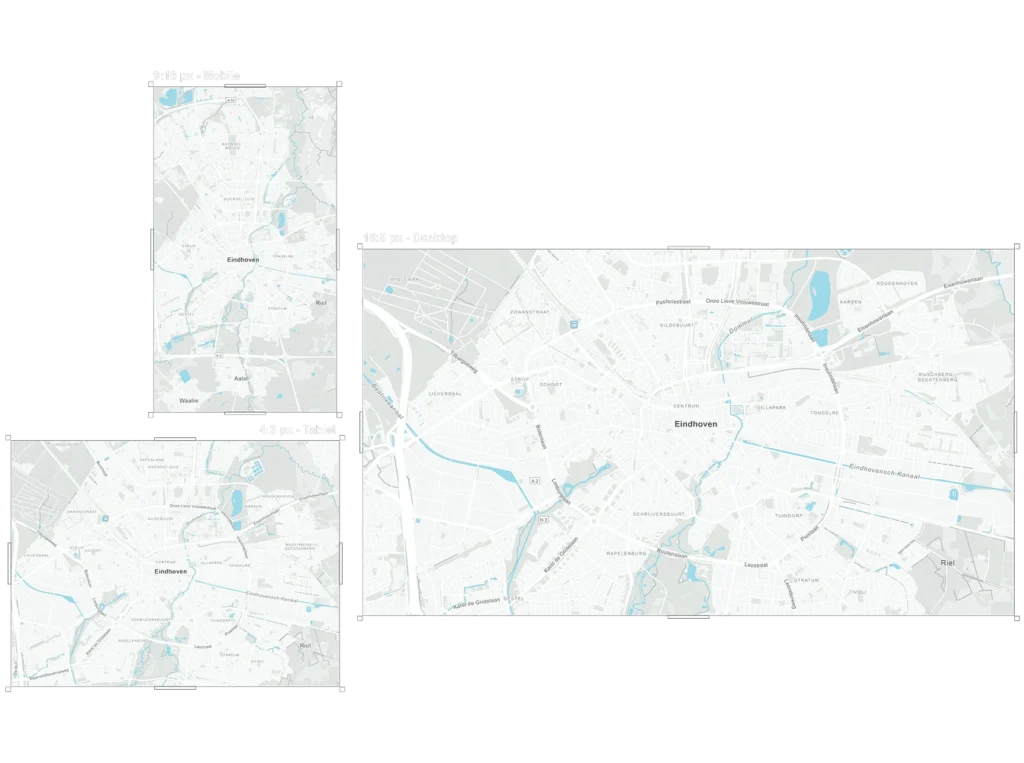
Keep interactivity for when it adds value
No, we aren’t saying that every map should be static.
Interactive maps are still the right choice when the reader needs to explore data, compare locations, search, zoom into details, or interact with layers. But interactivity should be a deliberate choice, not the default publishing model.
For many maps, especially article graphics and visual explainers, a static responsive export is the better long-term format.
Use interactive maps when exploration matters.
Use static maps when clarity, speed, ownership, and permanence matter.
And even when interaction is available, we shouldn’t assume everyone will use it. In a couple of New York Times graphics, around 15% of readers clicked a prominent interactive button. As former NYT graphics editor Gregor Aisch later clarified, that doesn’t mean the other 85% ignored the graphic. They simply didn’t click. His takeaway is an important one for mapmakers too: don’t hide the main story behind an interaction.
At Mapcreator, we believe map publishing should give teams freedom, not lock-in.
A finished map should be easy to publish, easy to move, easy to archive, and easy to keep online for years. Static exports make that possible.
Your website should own its published content. Your maps should be no exception.
Don't forget to share this post!
Deeper understanding of maps
For mapping tips, updates, and deep dives for the cartographically curious.
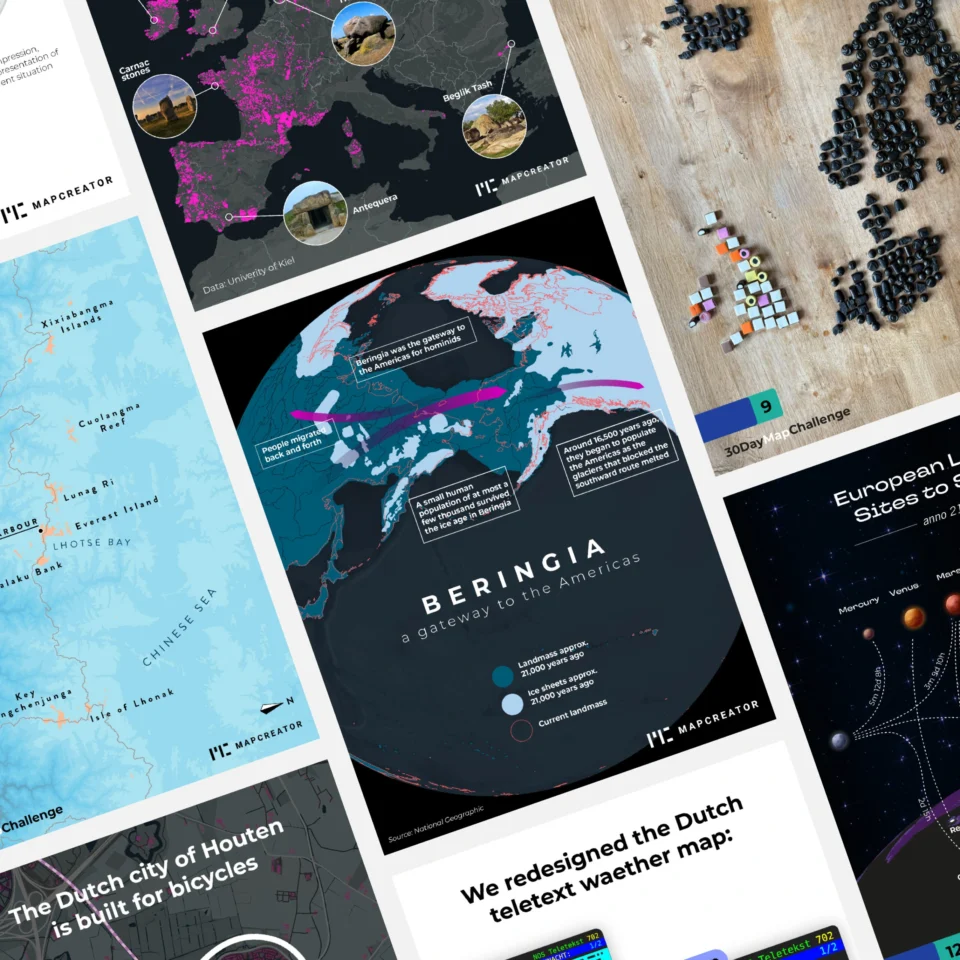
How influencers create maps that start conversations
Graphic designer, geo-influencer and Mapcreator ambassador Frans van der Vleuten uses maps to turn curiosity into conversation. We spoke with...
Read more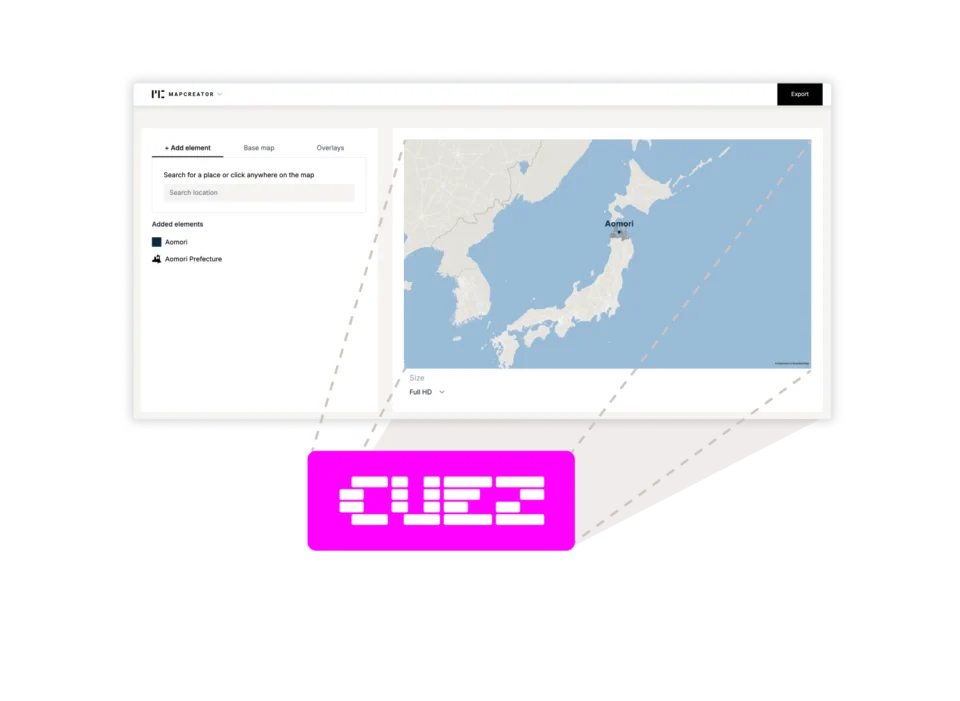
Locator maps inside your CUEZ rundown
The best newsroom tools are the ones that fit naturally into the way journalists already work. That’s why we’re excited...
Read more
Cloud Rendering: size and speed do matter
For years, Mapcreator has made it easy to get maps out of the tool in whatever format your production workflow...
Read more
Co-editing is here: Maps now move between teammates
Some map designs start with one person and stay that way. Nice and tidy. Others? Not so much. Maps rarely...
Read more
Choropleth maps in Mapcreator just got easier
A choropleth map is a color-coded map that shows how values differ between geographic areas, such as countries, regions, or...
Read more
We just do maps. And that’s the point.
A good map often looks effortless, and that’s the whole point. But behind that simplicity are countless cartographic choices, design...
Read more


