Import a spreadsheet with automatically numbered icons
If you’re manually placing numbered icons one by one onto a map, stop right there; we need to have a chat. There’s a better way. A faster, smarter, easier way. Over 1k locations to import? No problem.
Enter: data binding in Mapcreator. With data binding, you can upload a spreadsheet that automatically adds locations with numbered icons on your map — no click-heavy dragging or late-night label rearranging required.
What is data binding, anyway?
Think of data binding as your personal assistant that actually gets things right. By importing a spreadsheet (.XLSX, or even .TXT and .CSV) or other datafiles, Mapcreator links your data columns, like coordinates, labels, numbers, directly to visual elements on the map.
In this use case, you’re using data binding to place icons with index numbers, which is ideal for:
- City tours, museum stops, or even pub crawls
- Step-by-step guides (looking at you, urban trail planners!)
- Real estate properties
- Transport maps with numbered stops
- Breaking news locations
Import a spreadsheet with automatically numbered icons to create this map in under one minute:
Step 1: Drag-and-drop your spreadsheet
Drop your .CSV, .TXT or .XLSX into Mapcreator. The tool detects your headers and suggests which columns to use for geolocation (latitude/longitude or address). Confirm and proceed.
Step 2: Add the numbered icons
Edit the added location points by selecting them and changing them to a numbered icon. These icons have an editable text field. Then link its text field to the right column from your sheet, using the table icon next to it. They’re labeled instantly — no manual labeling, ever again!
(Optional) Step 3: style your icons
Apply colors from the icon_color column. Whether you want a bold, uniform look or individually styled steps, you’re in control.
Pro tip: Skip the table icon — just type
$-columnnameto quickly select data from your sheet!
Step 4: Add data to popups
This is where your map becomes more than a graphic — it
becomes a story.
Using the Popup editor:
- Bind the image_url to display a unique visual
- Add text from name, label_text, and description
- Format text for clarity: bold titles, line breaks, font scaling
Each Popup is unique, dynamically generated from your spreadsheet as our tool smartly pulls the data from your cells and connects it to the icons they belong to.
Step 5: Export and share
With everything styled and interactive, export your map as:
- An interactive embed. Want to make changes to your map? Just re-open your project, make any changes and export again. Your map will now automatically get updated.
- A vector SVG for design editing
- A PDF for print or presentations
Pro tip: You can bulk-edit your icons right from the spreadsheet — change colors, sizes, labels, rotation, or even add interactivity across the board. Want to fine-tune just one? Click it again to select and style it individually.
Why users love this feature
Users can go from a raw spreadsheet to a fully styled, interactive map in minutes. All with no need for manual placement, other graphic tools, nor GIS knowledge. It’s flexible enough to handle thousands of entries at once, yet intuitive enough for quick one-off projects. The real magic happens when you link text, images, and colors directly to your data!
Save time, save your wrist
Data binding has never been easier, all while you stay in full control over your data. Did you know Mapcreator’s personal plan allows for (temporarily) unlimited SVGs & PDFs and unlimited interactive maps for only €99 a month?
Don't forget to share this post!
Deeper understanding of maps
For mapping tips, updates, and deep dives for the cartographically curious.
Choropleth maps in Mapcreator just got easier
A choropleth map is a color-coded map that shows how values differ between geographic areas, such as countries, regions, or...
Read more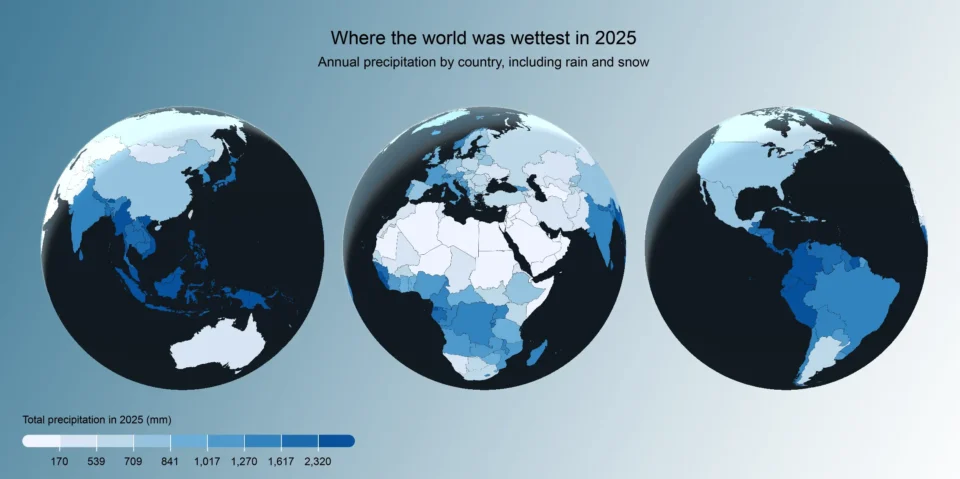
Why bringing your own data can make for better maps
Some maps do not begin as maps. They begin as bits and pieces of information waiting to make sense together....
Read more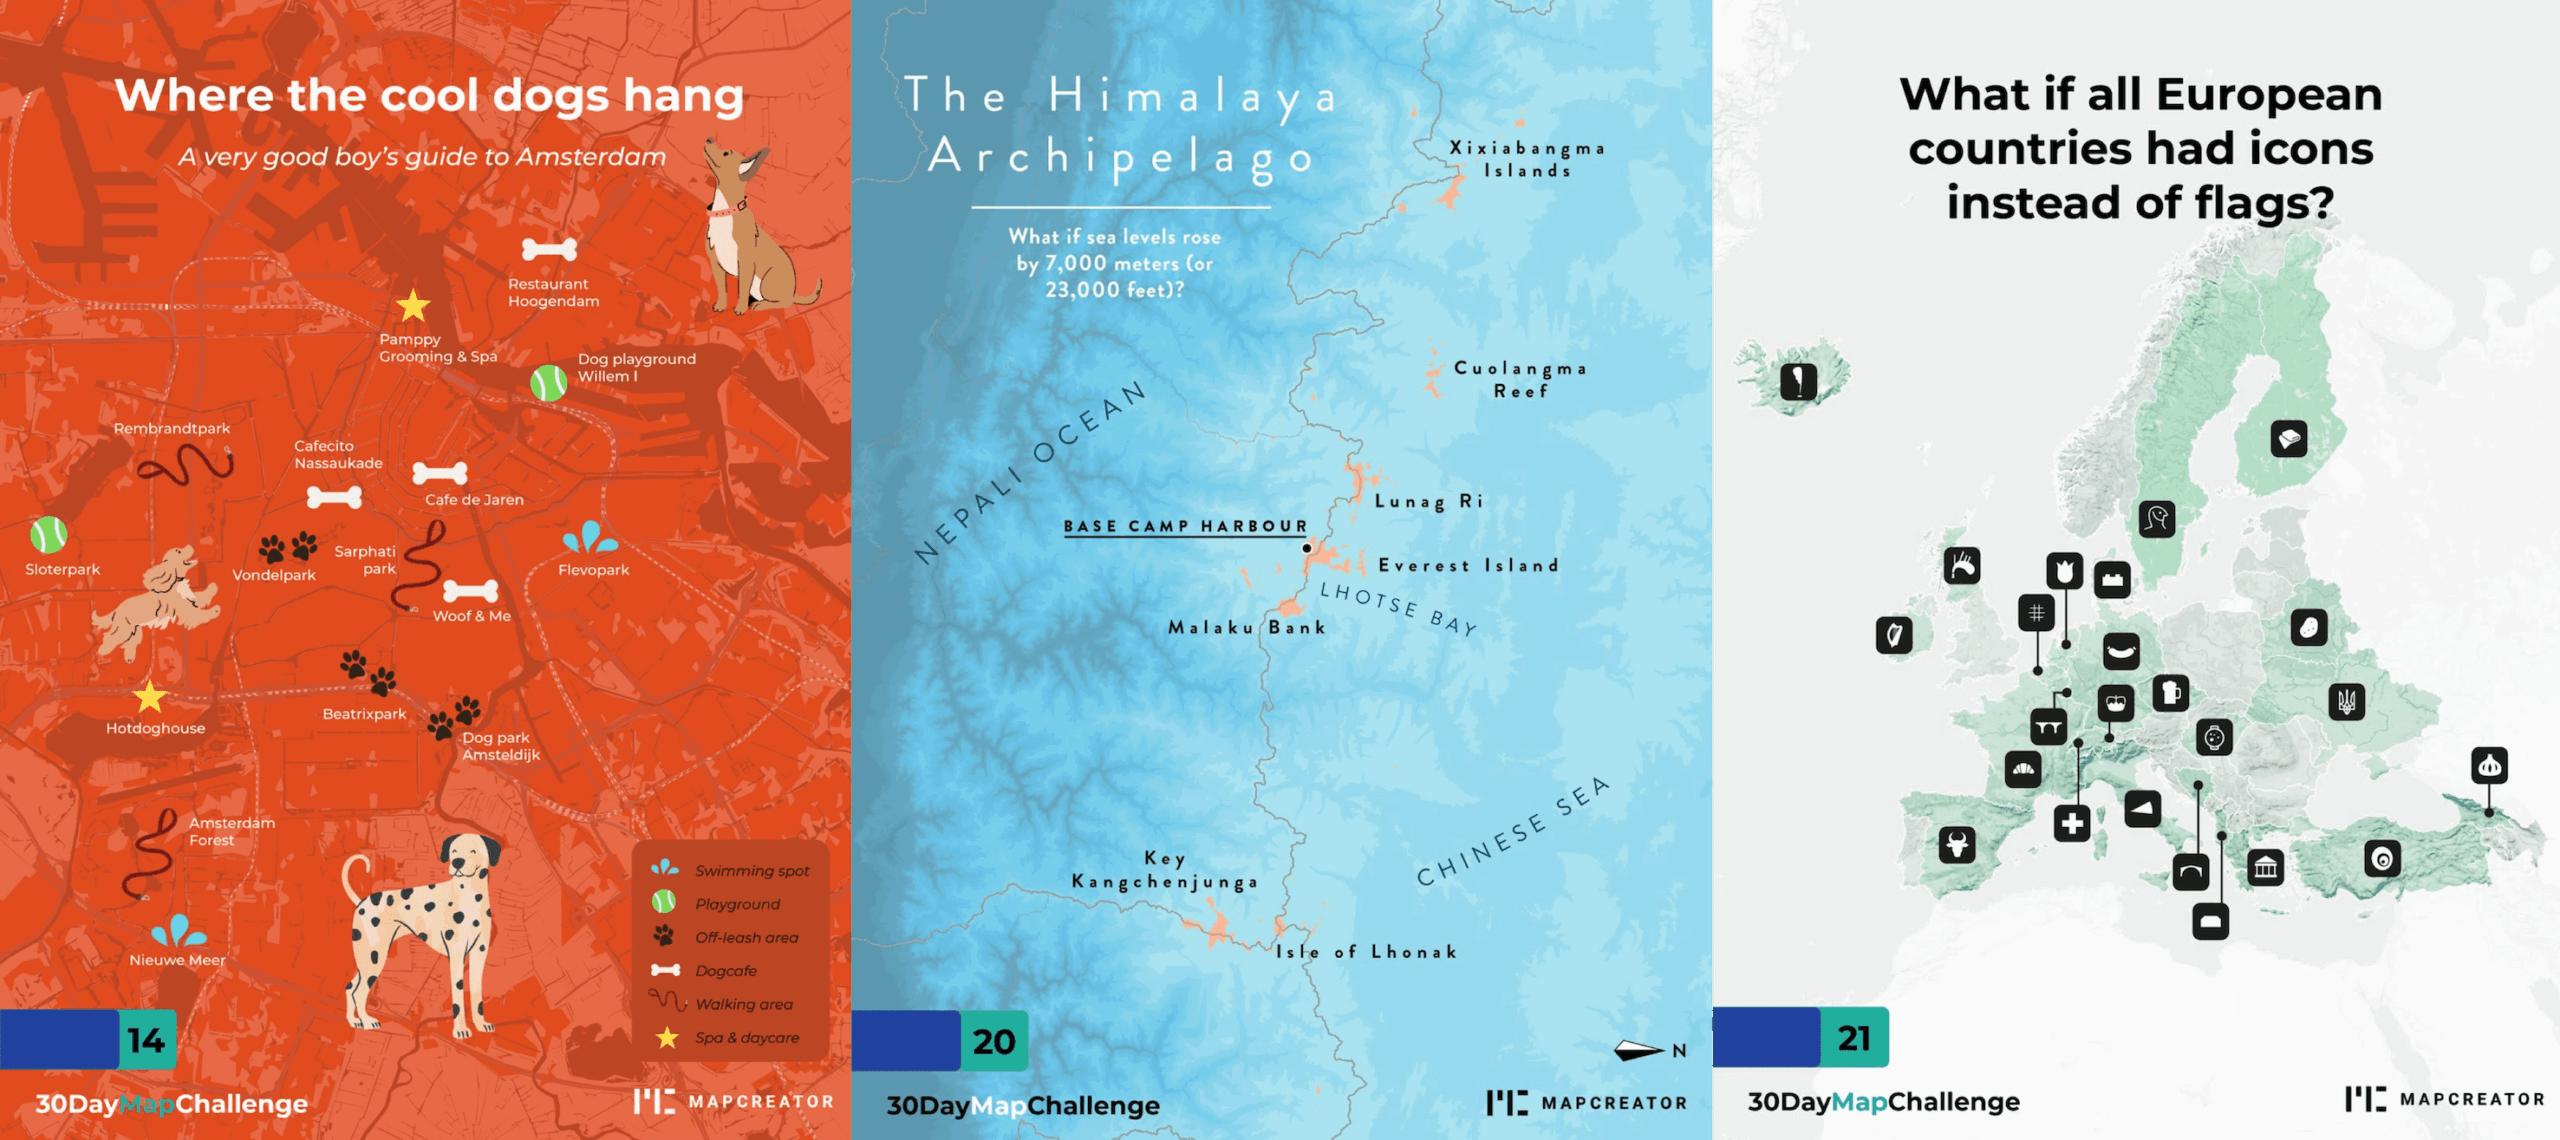
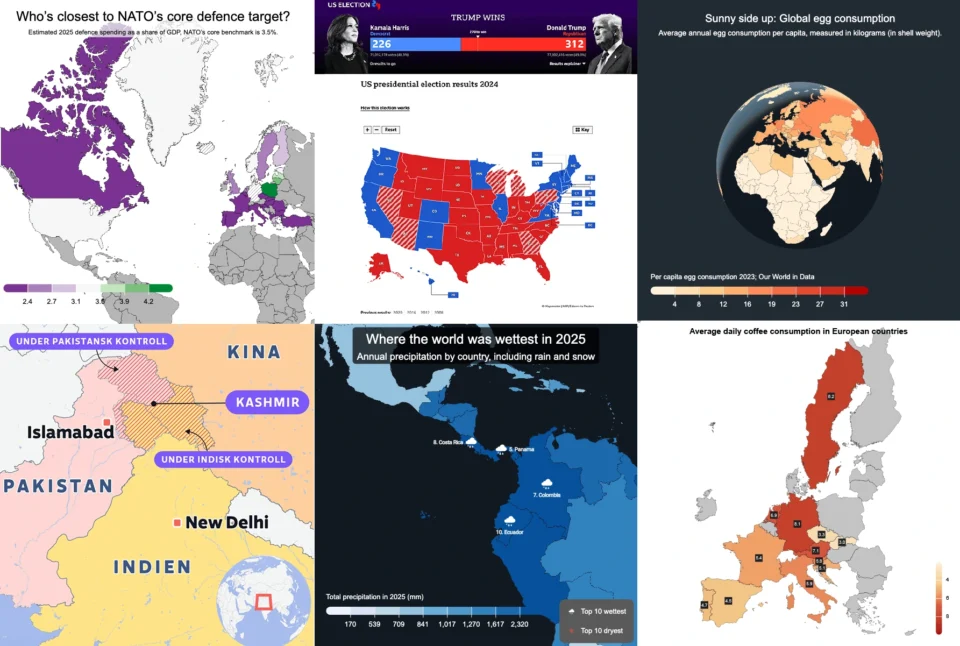
What the 30 Day Map Challenge taught us about creativity (and Mapcreator)
Every November, cartographers, designers, and data nerds gather around the same global campfire: the 30 Day Map Challenge. The rules...
Read more
Your 2026 Winter Olympics maps are here!
Italy is getting ready for the 2026 Winter Olympics. Snow, ice, roaring crowds, and at least one person asking if...
Read more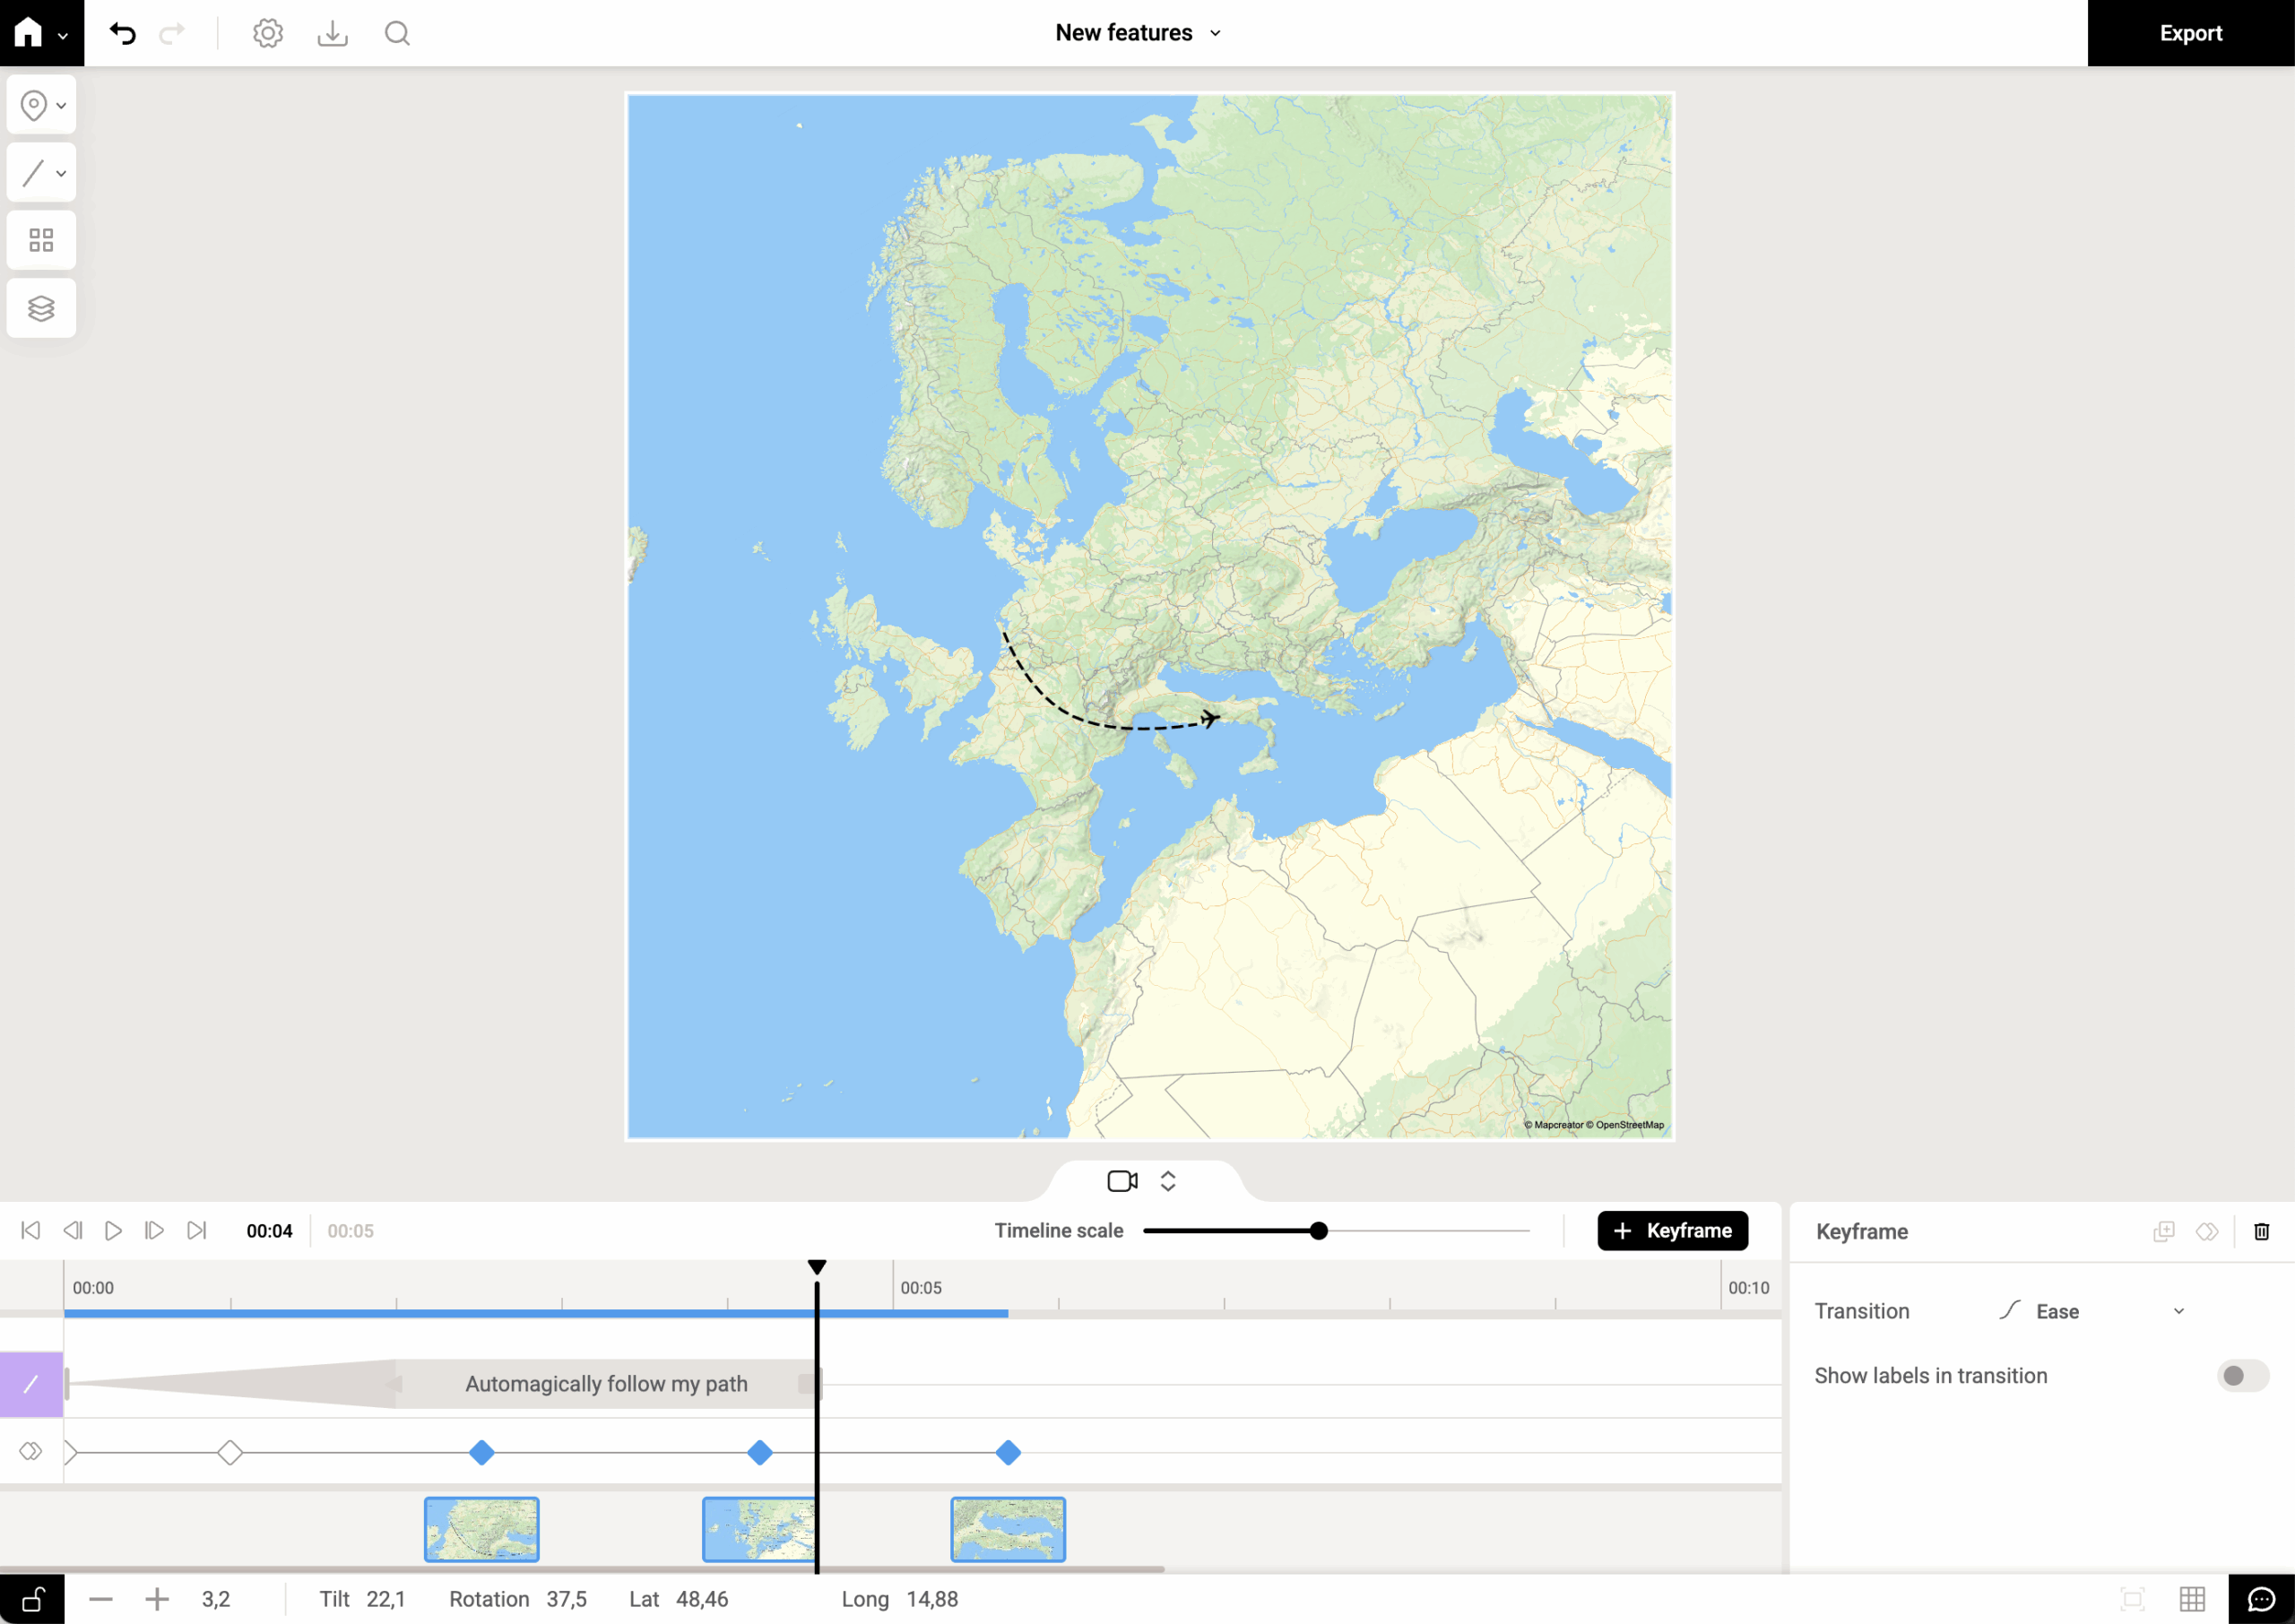
New! Map animations, now on autopilot with auto-keyframe
We’ve all been there: you want to animate a camera smoothly along a winding route (or just from point A...
Read more
New! Render Globe Maps as Vector Files
We don't like world maps. There, we said it. Most world maps you come across are distorted. When you flatten...
Read more