


PBS chooses Mapcreator for its 2026 US midterm election coverage
Election maps carry a particular responsibility. Viewers rely on them to make sense of results, and newsrooms need maps that present those results clearly, accurately, and on time.
At Mapcreator, we’re a team of cartographers and map enthusiasts. Maps are our whole focus, and we have decades of experience improving maps for newsrooms. Over the years, we’ve helped broadcasters bring election coverage to their audiences, and we’ve been trusted with election projects for Amazon Prime, the BBC and TVA. For the 2026 US midterm elections, PBS chose Mapcreator to provide customized maps for its TV and web coverage.
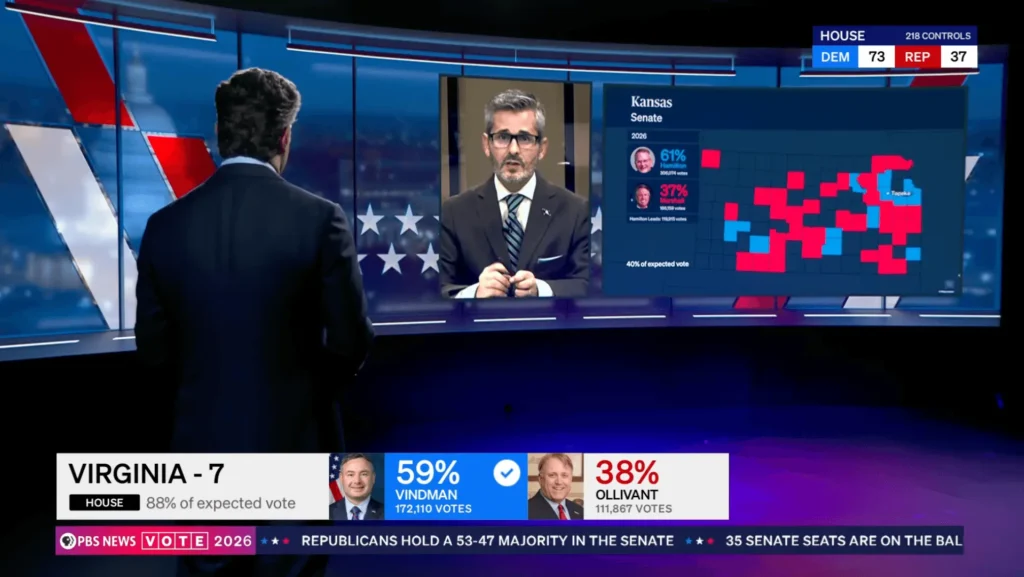
One election, two ways to follow the results
Election night puts maps to work in two very different places. On television, presenters need clear visuals to help explain results. Online, viewers want a way to follow the races themselves.
The TV maps designed for PBS’s live coverage gave Lisa Desjardins and her colleagues a visual way to guide viewers through results and explain what they meant for individual races. The example above shows Virginia’s 7th congressional district, with candidate vote shares and totals, a winner indicator, and the share of expected votes.
That level of detail helps turn election numbers into a story viewers can follow. A presenter can point to a district, show where a race stands and put the results in their geographic context.
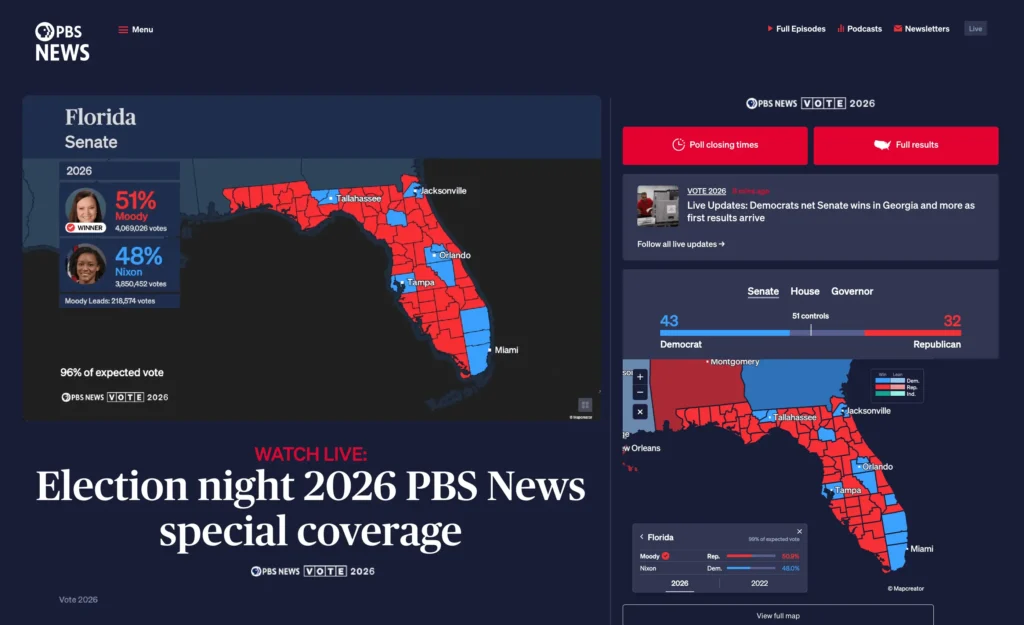
The web experience gave viewers a dedicated way to follow the election maps online. At their own pace, political enthusiasts dive into their areas of interest, explore results and compare them with previous election years. The two experiences combined gave PBS maps suited to how people follow election coverage, whether they were watching on television or checking results online.
Customized for election coverage
Election maps need to do more than show boundaries. They need to present the right information clearly, fit the visual style of the broadcast and work for the way audiences follow results.
For the 2026 US midterm elections, Mapcreator provided PBS with a customized solution for both platforms, bringing live election results to life across TV and web. With updates coming in every few seconds, results for the Senate, House and Governor races gradually colored the map from East to West as polling stations began reporting.
As AP called winners across the country, the maps played a vital role in visualizing the outcomes, from closely contested races to landslide victories. For deeper analysis, comparisons with previous election years helped illustrate shifts in voter behavior, while maps preloaded with specific state or race views ensured the right information could be brought to the relevant channels immediately.
Each platform served a distinct purpose, with TV and web maps tailored to their respective audiences, while both helped viewers make sense of the same election as it unfolded.
A growing history of election projects
Mapcreator has supported election coverage for years. Our election maps played vital roles on Amazon Prime, BBC and TVA. We’re proud that PBS chose Mapcreator for its 2026 US midterm coverage too. During election night alone, the maps handled over over half a million views online, with numbers still growing as final results are released in the coming days.
Every election brings its own stories, audiences and production needs. The maps are shaped around the coverage they need to support, from digital experiences to presenter-led graphics in the studio. The next 2 years will go by faster than expected, and we’ve proven to be a valuable election graphics partner. We’re ready to discuss your requirements anytime, and we’ll gear up for the general election 2028.
Don't forget to share this post!
Deeper understanding of maps
For mapping tips, updates, and deep dives for the cartographically curious.
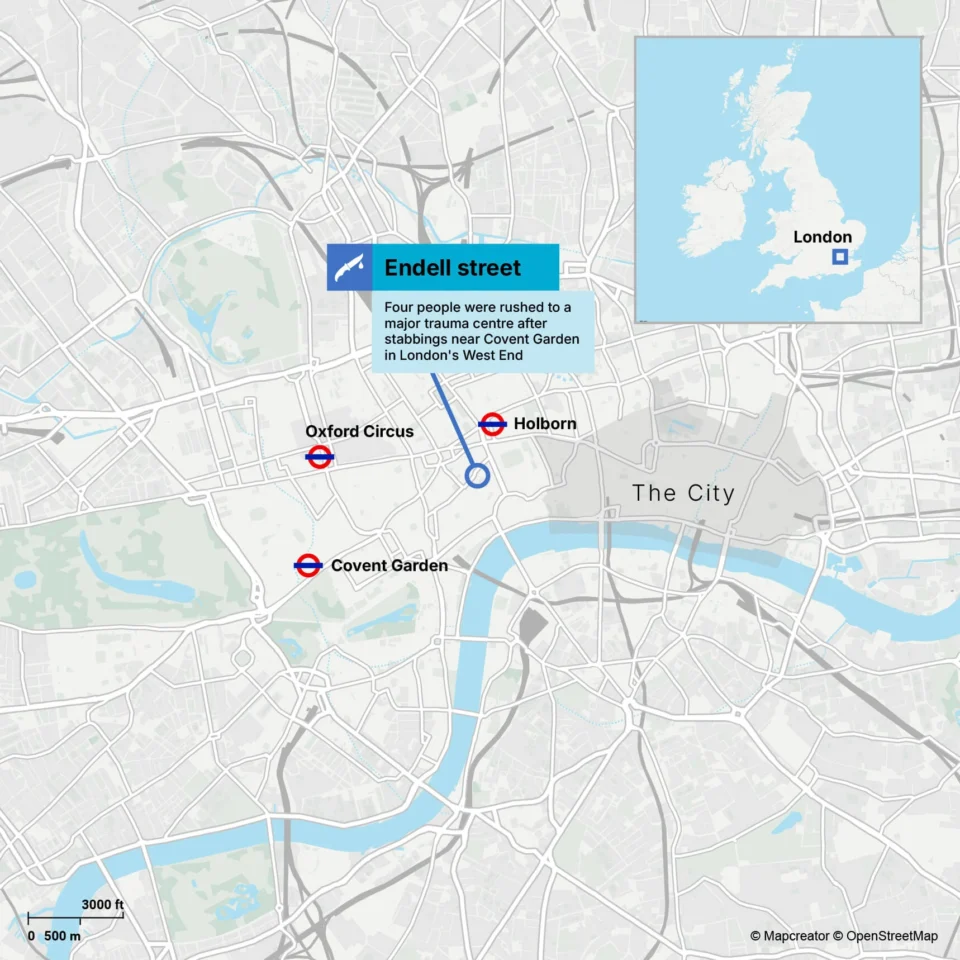
POV: Should have been a static map
Interactive maps are powerful. They let readers zoom, pan, click, explore, and discover details at their own pace. But not...
Read more
How influencers create maps that start conversations
Graphic designer, geo-influencer and Mapcreator ambassador Frans van der Vleuten uses maps to turn curiosity into conversation. We spoke with...
Read more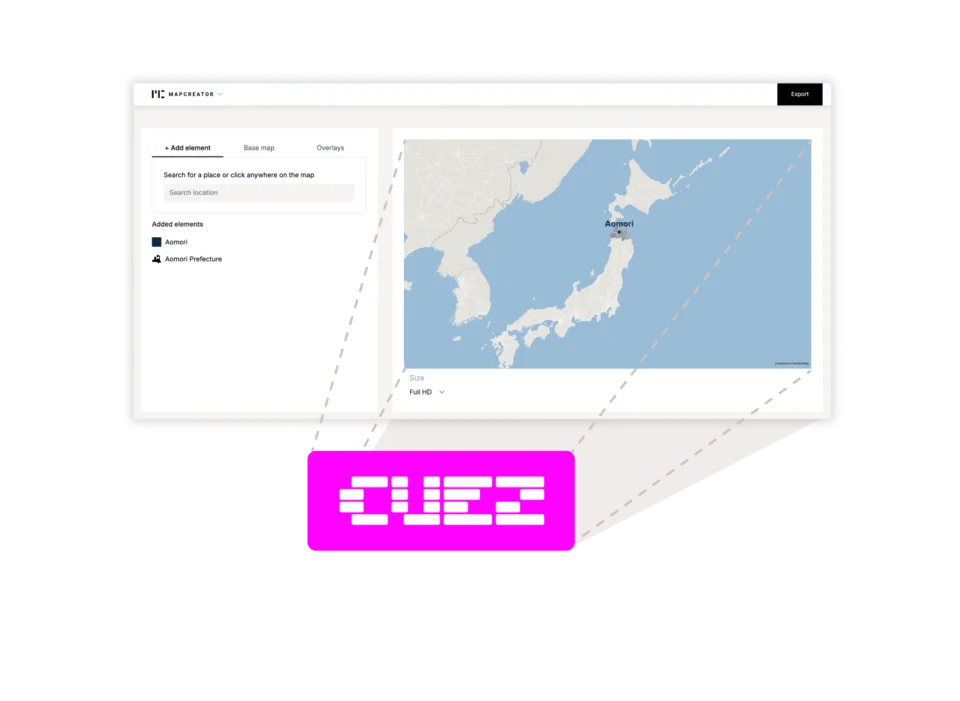
Locator maps inside your CUEZ rundown
The best newsroom tools are the ones that fit naturally into the way journalists already work. That’s why we’re excited...
Read more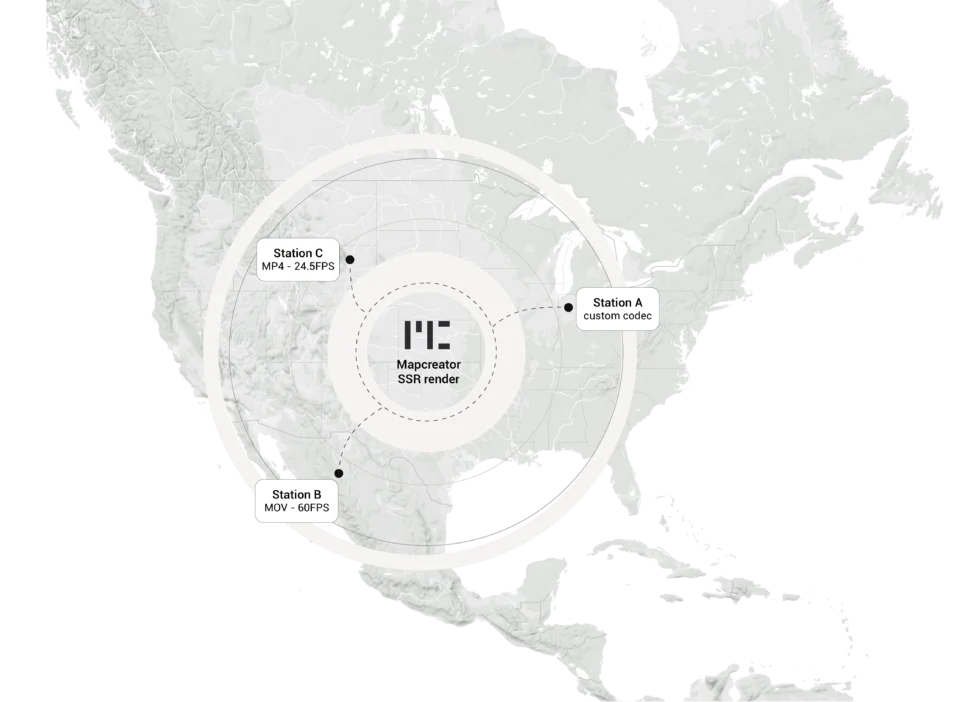
Cloud Rendering: size and speed do matter
For years, Mapcreator has made it easy to get maps out of the tool in whatever format your production workflow...
Read more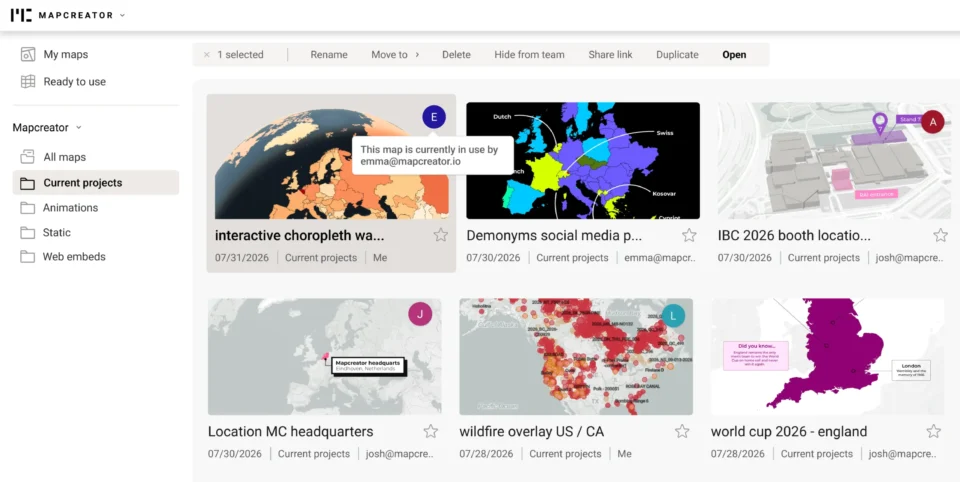
Co-editing is here: Maps now move between teammates
Some map designs start with one person and stay that way. Nice and tidy. Others? Not so much. Maps rarely...
Read more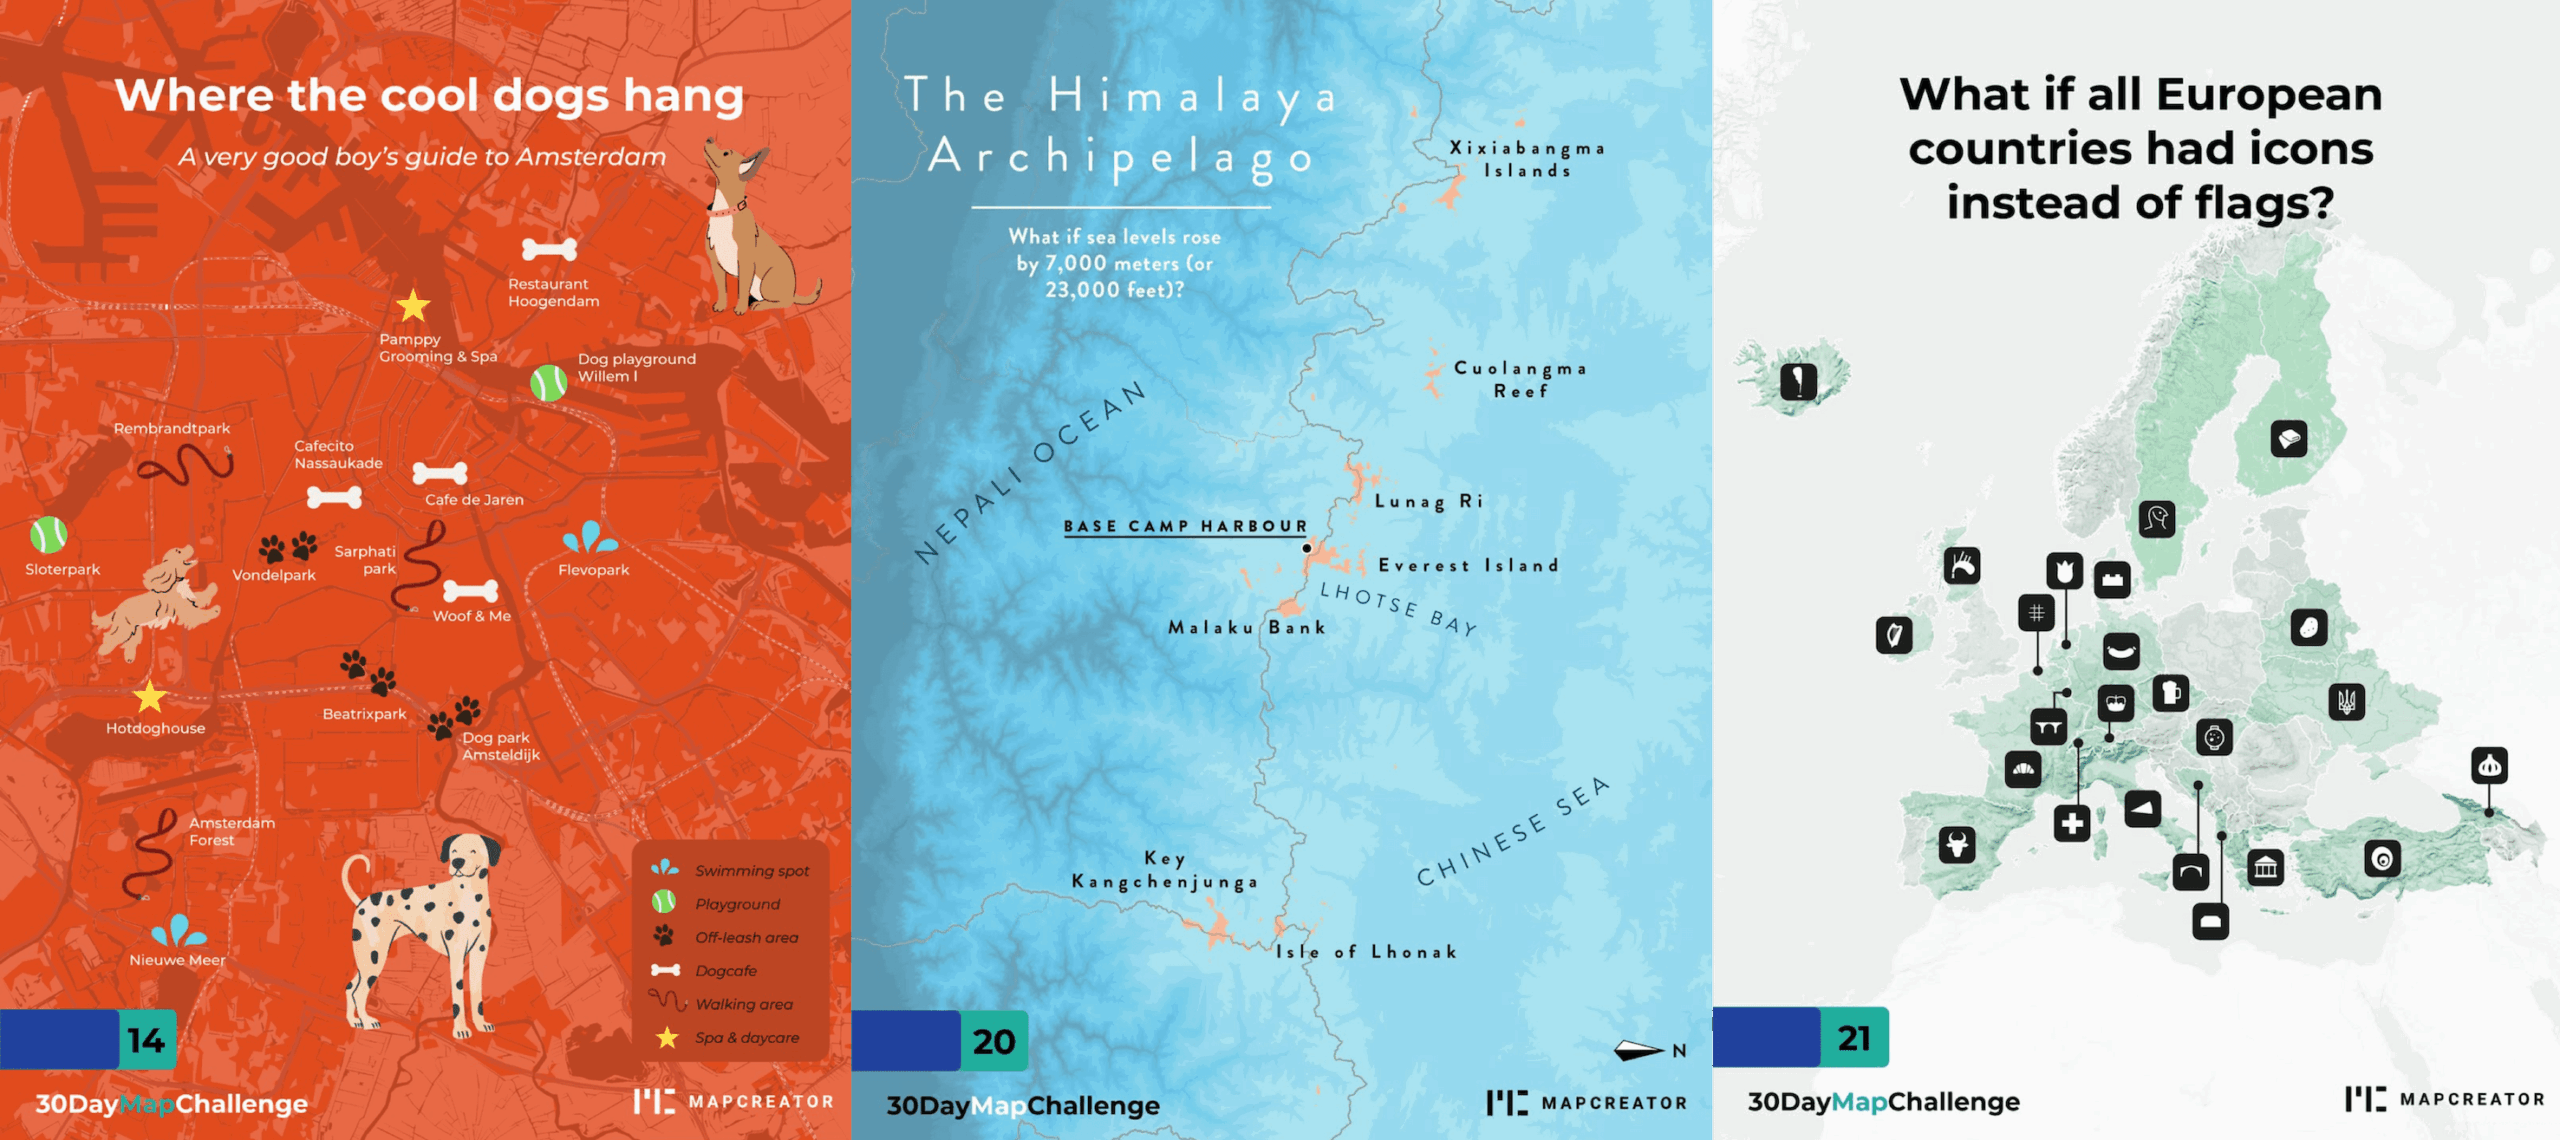
What the 30 Day Map Challenge taught us about creativity (and Mapcreator)
Every November, cartographers, designers, and data nerds gather around the same global campfire: the 30 Day Map Challenge. The rules...
Read more


