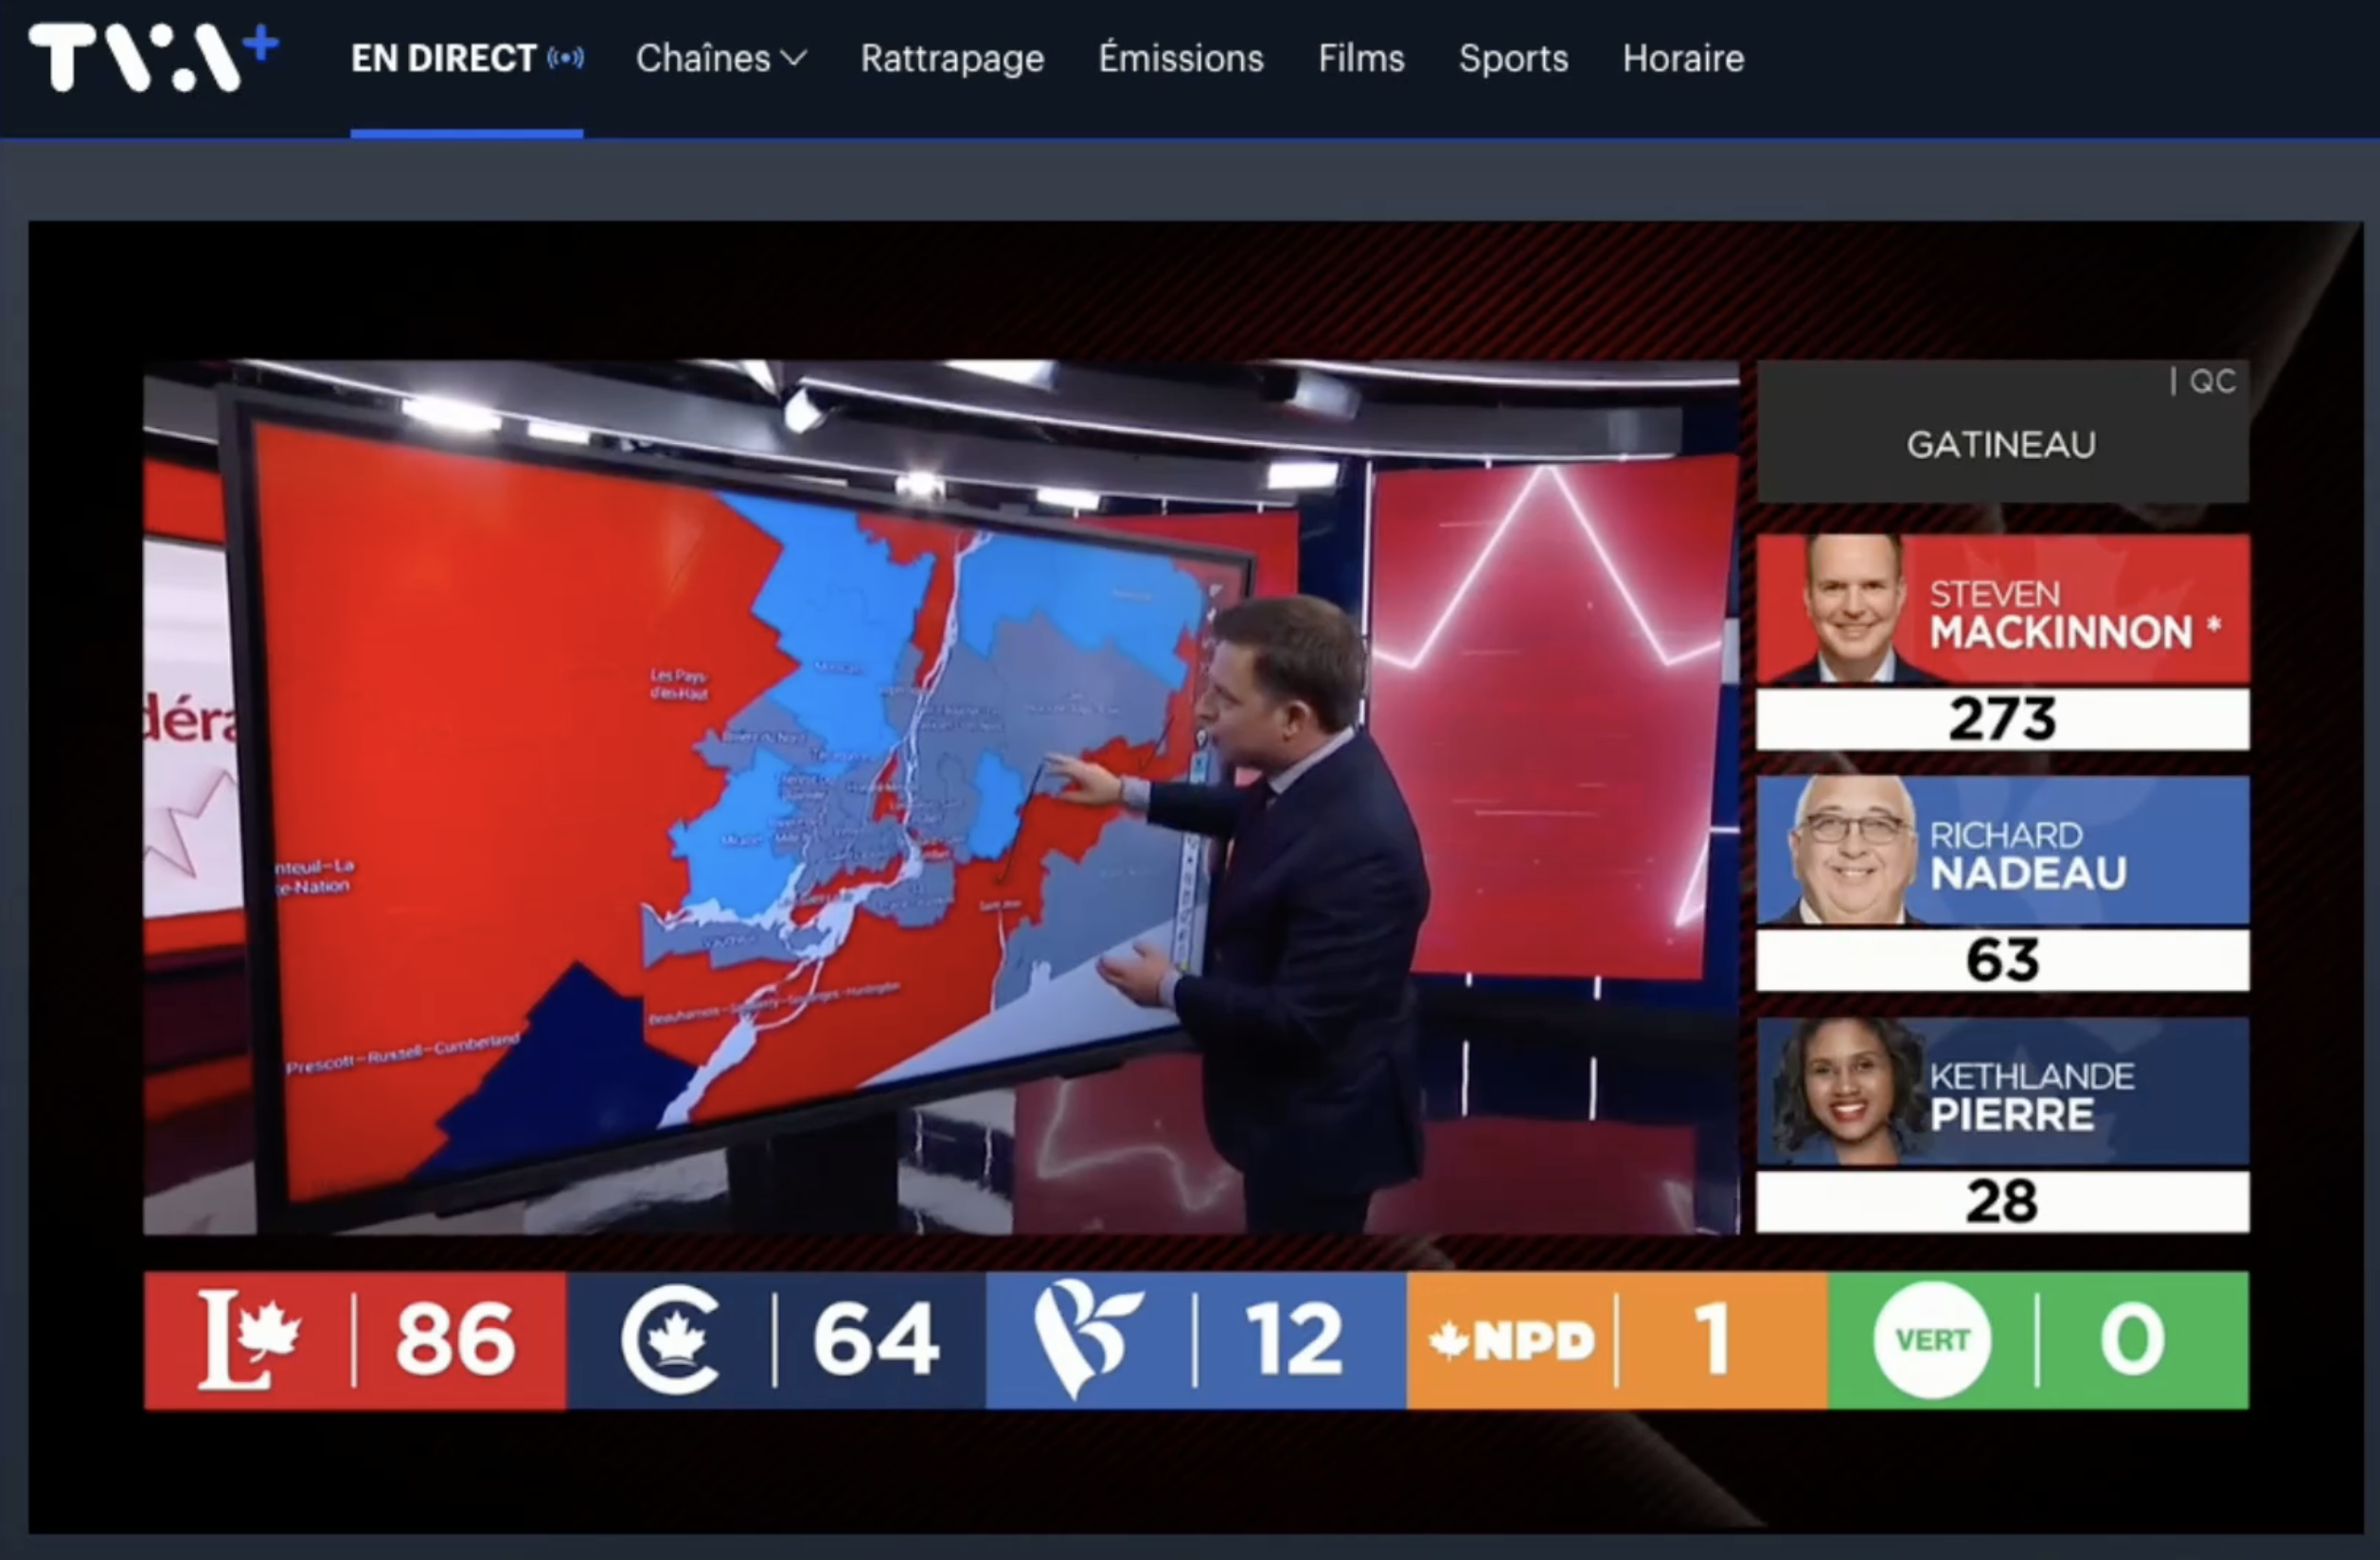
TVA – Canadian elections 2021 map
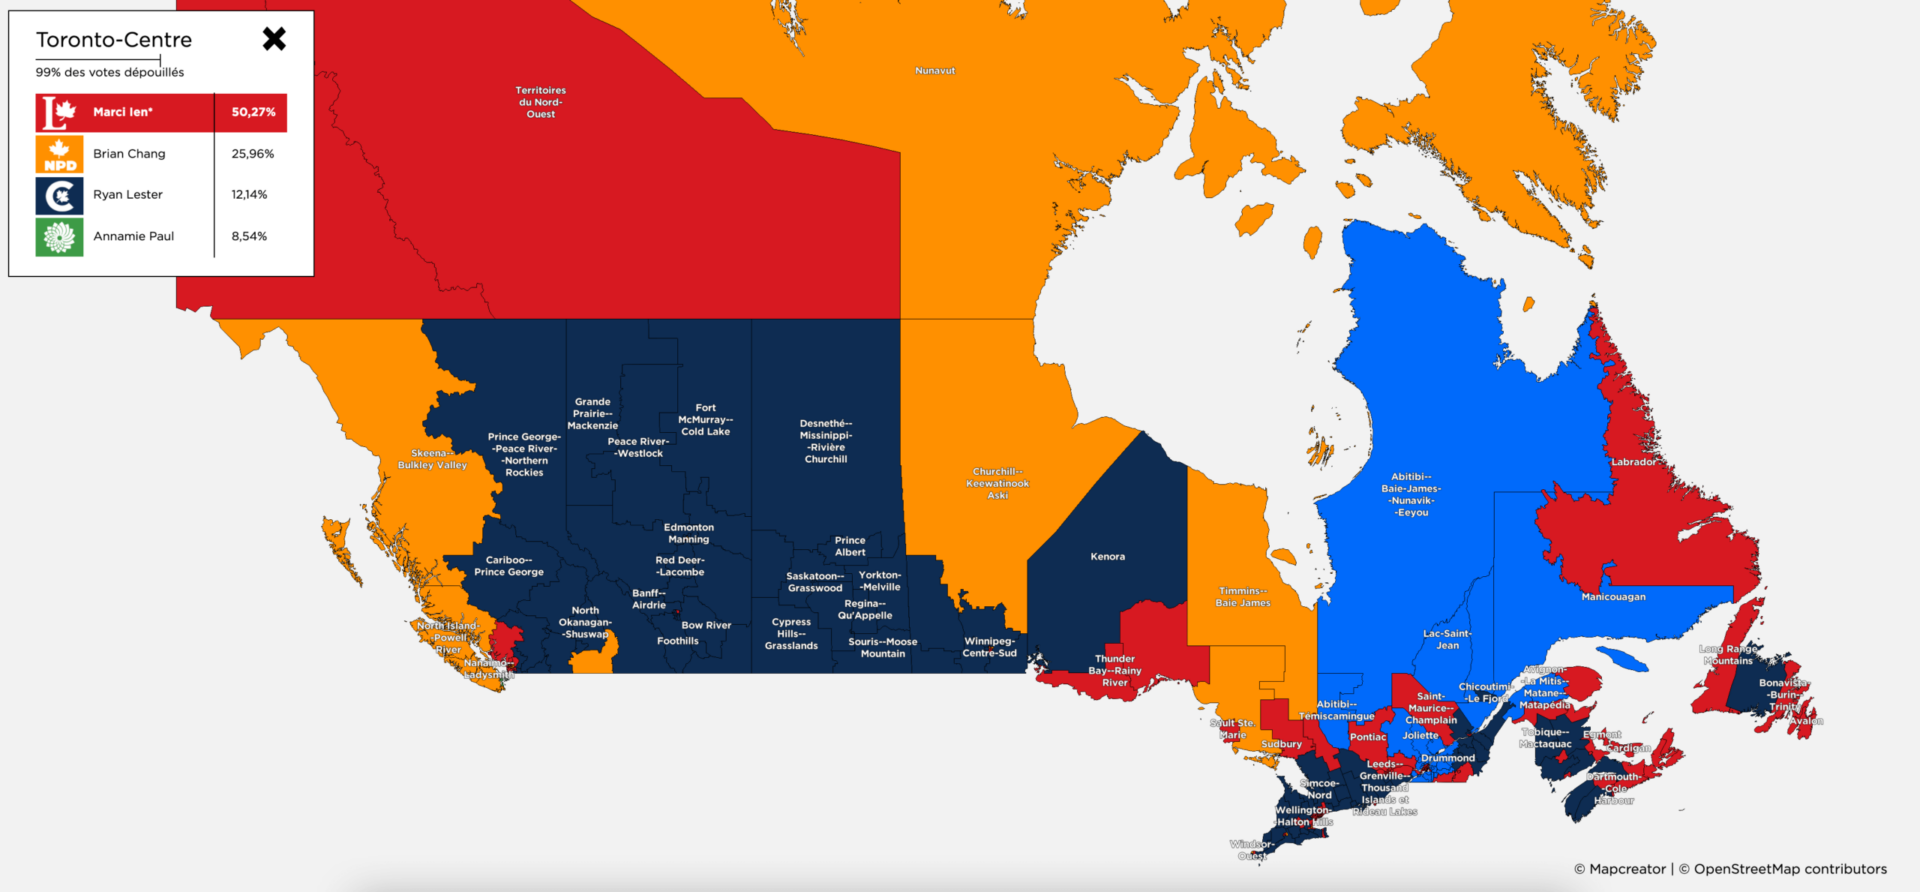
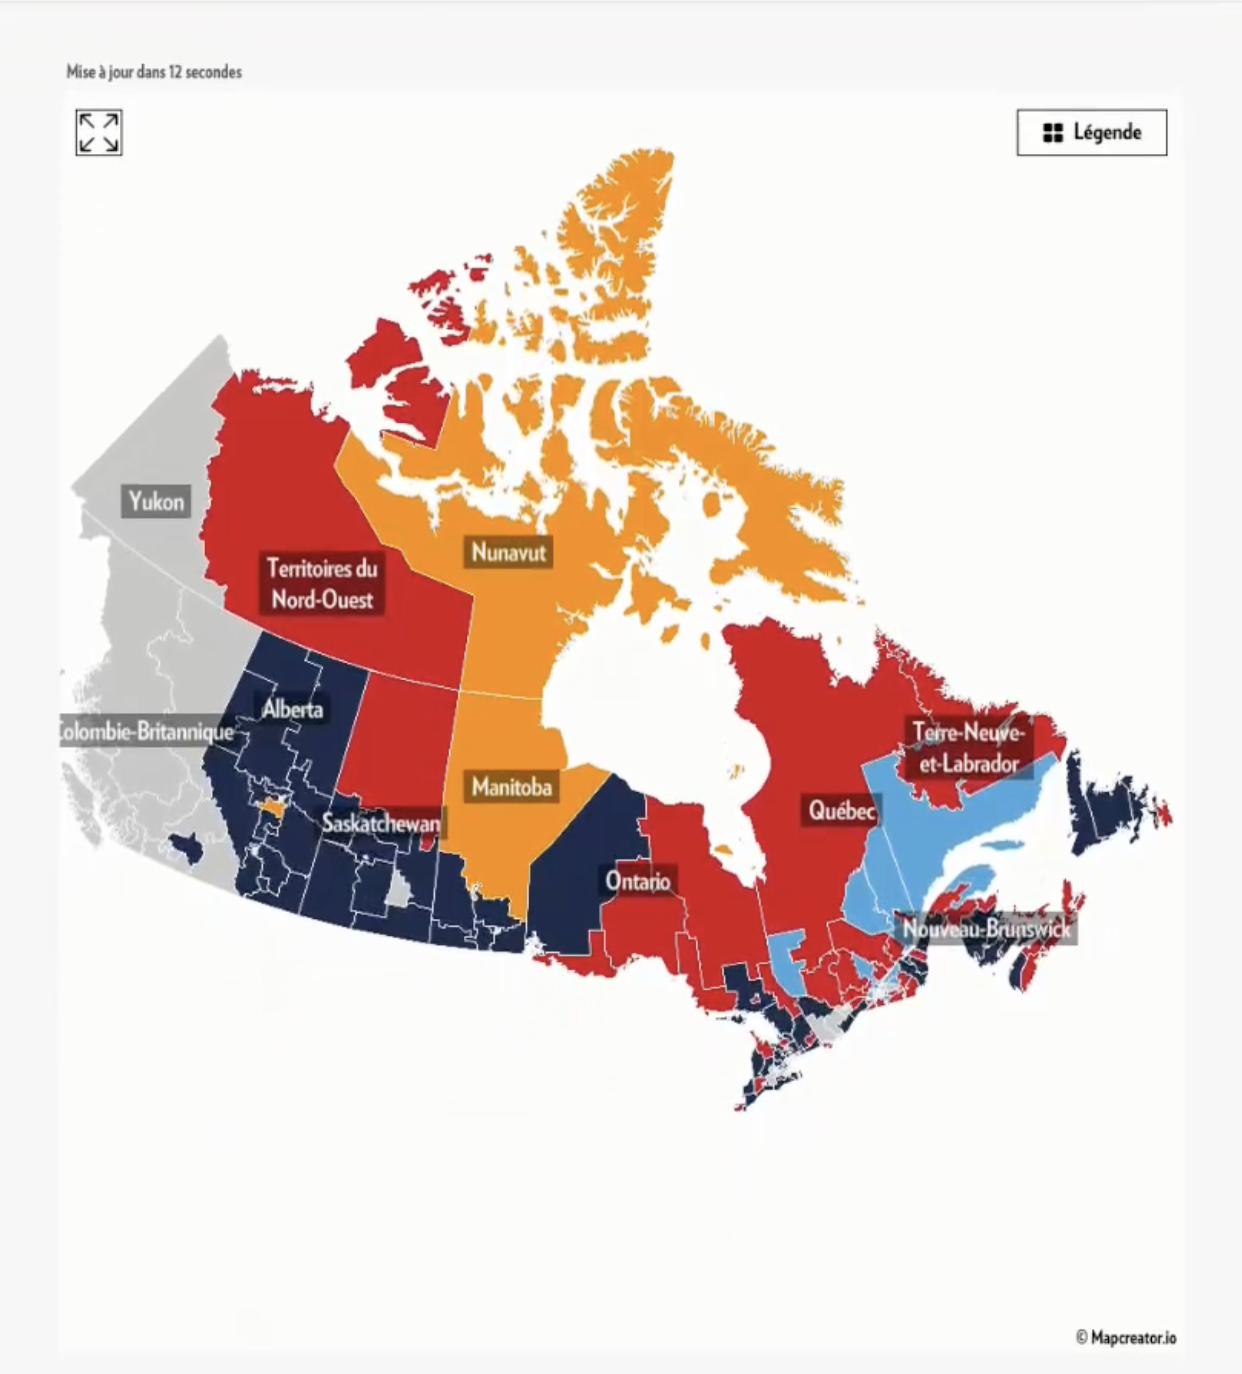
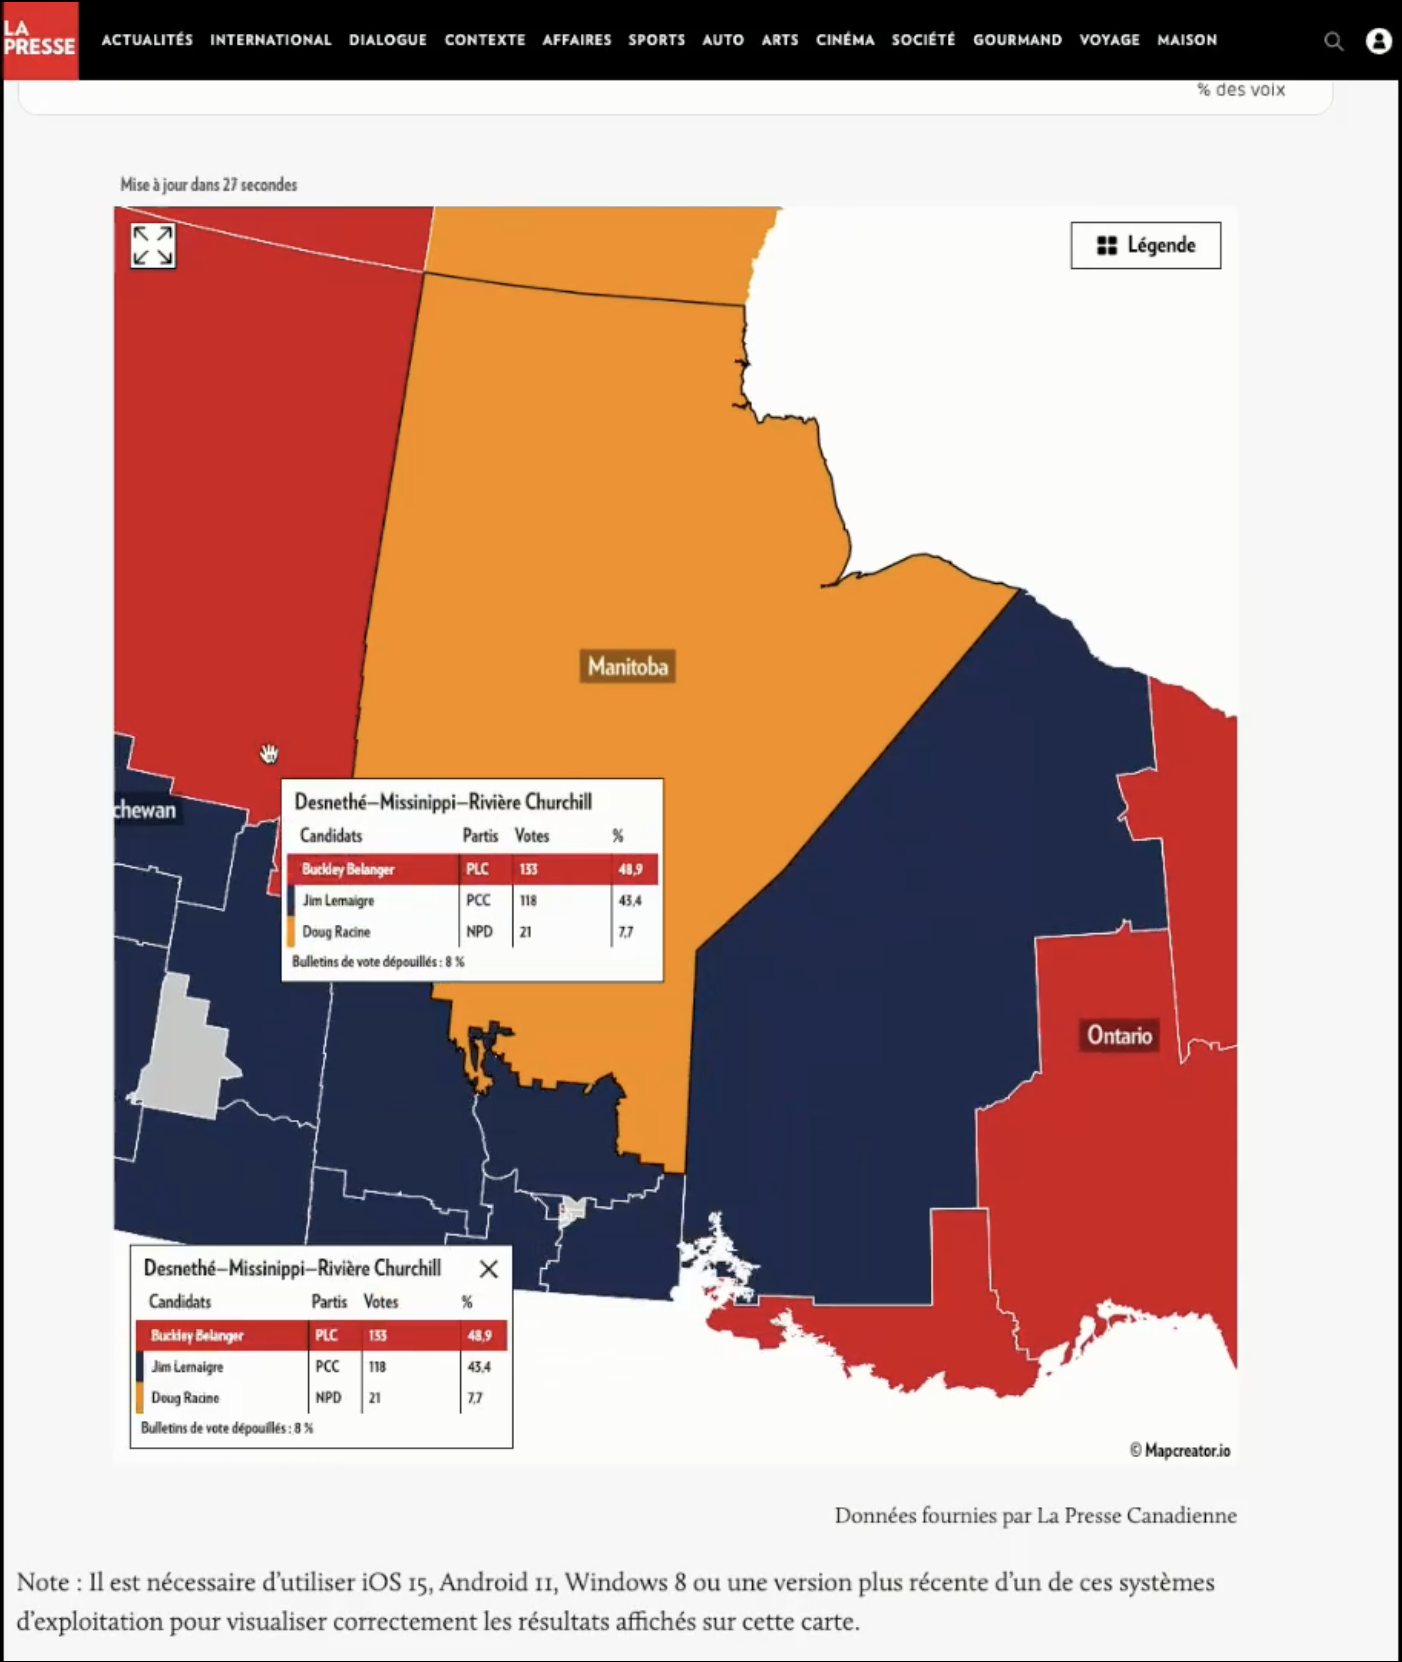
This image is a screenshot of an interactive choropleth map, showing an Election project for Canada.
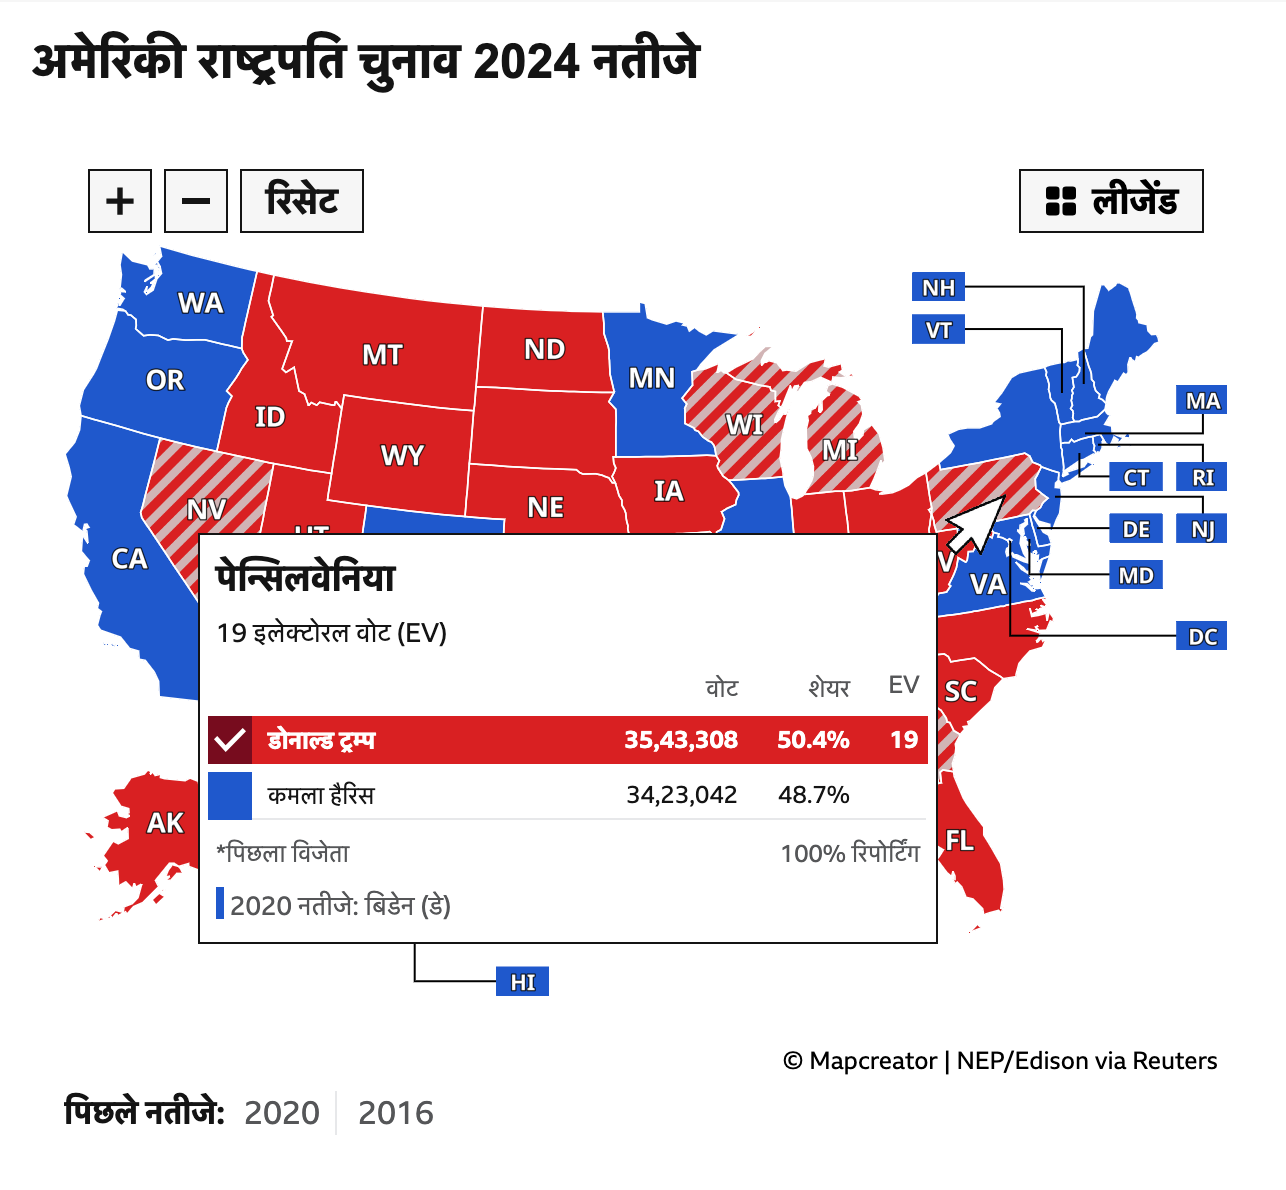
You can see that this map is color coded depending on the votes, and by clicking on locations more information about the exact distribution of the votes becomes visible. Location labels have been added onto the various regions in Canada.
The pop-up on the map can be closed if you want to have a more general view, or the readers can zoom into specific parts to get more details.
Don't forget to share this post!
Similar Election maps
Explore beautiful, clear maps created by real teams in media, real estate, government, and more. Each one tells a unique story with location.