Sky News Australia – Australian Federal Election Coverage 2025
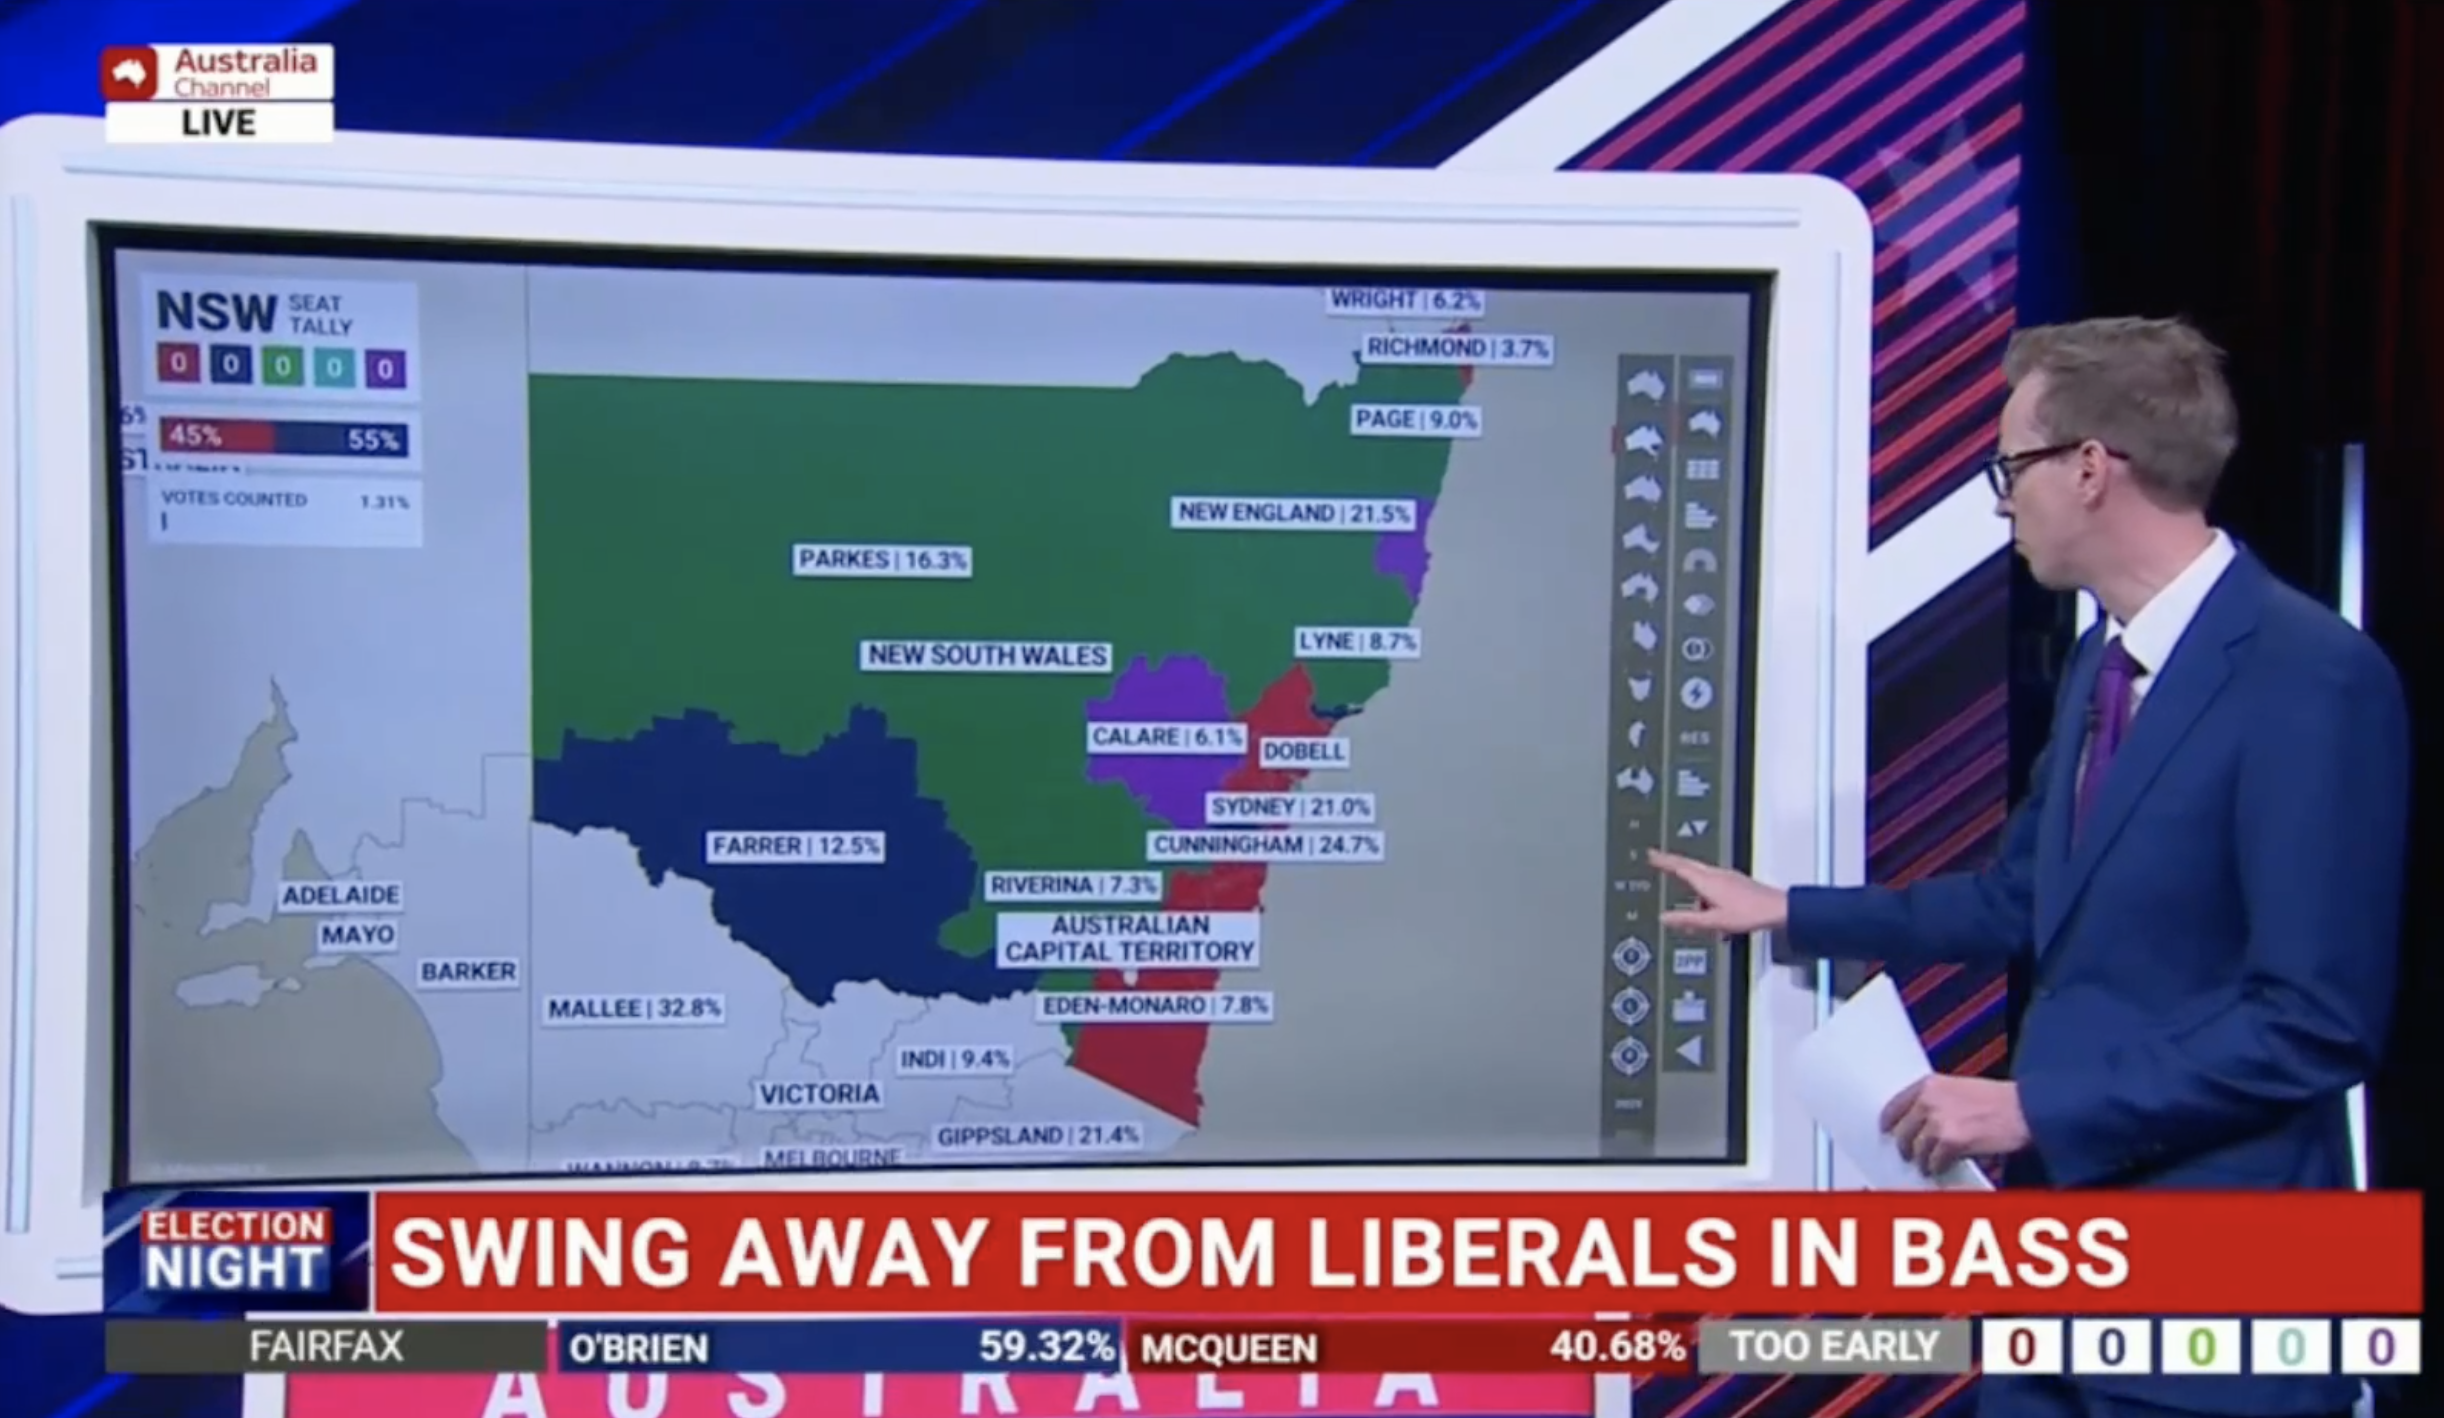
This image shows a live broadcast from Sky News Australia during the Australian Federal Election coverage, focusing on early results and electoral swings across New South Wales (NSW).
A presenter in a navy suit stands next to a large interactive touchscreen displaying a color-coded electoral map of NSW with various districts labeled and overlaid with percentage values. These values likely represent vote swings or percentages counted. The regions are colored by party affiliation:
Dark Blue: Liberal Party
Green: National Party
Red: Australian Labor Party
Purple: Independents or other parties
Some notable values shown:
Farrer: 12.5%
New England: 21.5%
Sydney: 21.0%
Cunningham: 24.7%
Mallee (Victoria): 32.8%
Calare: 6.1%
Eden-Monaro: 7.8%
Don't forget to share this post!
Similar Election maps
Explore beautiful, clear maps created by real teams in media, real estate, government, and more. Each one tells a unique story with location.