Covering the war in Ukraine is of paramount importance as it sheds light on one of the most critical geopolitical conflicts of our time.
The Russian invasion in February of 2022 has had far-reaching impacts: not only for the region but also for global politics and security. It involves complex dynamics between Russia, Ukraine, and other countries, making it a crucial topic to be informed about.
Think-tanks and policy organizations have scrambled to provide insight and coverage. And while the expertise on the subject is vast, visualizing it well and effectively cannot be done without compelling maps of the conflict.
This summer, Mapcreator is proud to be using deepstatemap’s data, a trusted source of real-time geographical information that tracks developments in the war. It shows areas of current control, unit locations, and more. All updated on an hourly basis.
You can now pull the latest updated dataset from deepstatemap.live to place in your Mapcreator map. All attribution is covered under a paid Mapcreator plan, and you can freely publish your map visual to your website, blog, or social media account.
For think tanks or news organizations covering daily or weekly events in Ukraine, deepstatemap’s new dataset and options makes creating visual context around local or hyperlocal events not only authoritative, but easy to comprehend:
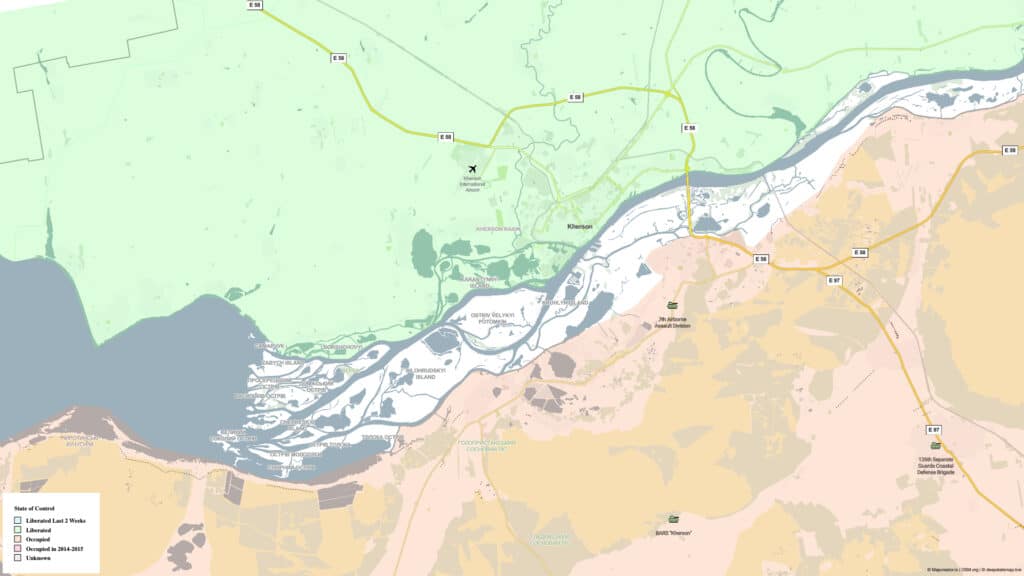
In early August 2023, we saw Russian strikes into the heart of the bitterly contested city of Kherson. If maps existed alongside the reporting, they were at best locator maps. With deepstatemap’s dataset, you can show the areas of control, in addition to indicating the presence of a Russian unit shown here – the 7th Airborne Assault Division.
Animate it in seconds!
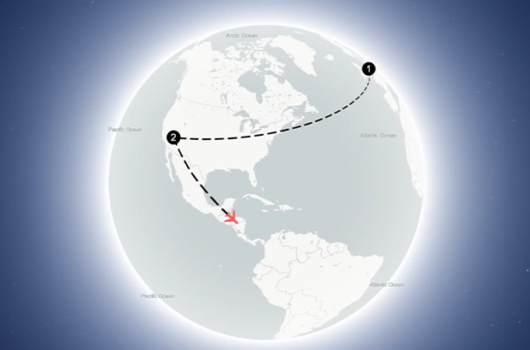
Or if a static image won’t do, there’s always the exciting option of using Mapcreator’s newly released animation making tool. In just a few clicks, we can show an overview of Ukraine, then zoom into Kherson like this:
You can repeat this as often as you’d like, wherever in Ukraine (or the world) you want to go. Don’t settle for basic locator maps in your latest analysis or blog – use our extensive datasets to give critical context to the fighting in Ukraine.
Interactive maps with real-time updates
Those who prefer an interactive dashboard can also use Mapcreator’s native embedding tool:
If you prefer a resource like this, the map data will be updated automatically in real-time from deepstateua’s data stream. Our interactive maps also can have on-click or hover pop-ups that contain more info about the unit locations.
There’s always more…
With Mapcreator, our geodatabase uses the globally recognised pre-2014 borders of Ukraine, which includes the Crimean peninsula. Since so much of the fighting is localized and focused in Ukraine’s east and south, we also have a complete database of Ukraine’s oblasts – letting you fully control how to visualize the country’s political map.
Our stories and research on Ukraine needs visually compelling and factually accurate maps. Mapcreator is the tool that will augment your written products with engaging and thoughtful visual content – critical to understanding the contours of this conflict.
You can get started with our Ukraine data right now – sign up for a free account and see what you can create with the data layers yourself!
Or request a free demo with one of our mapping experts!