Create interactive, data-driven maps
Create fully data-driven, interactive maps with Mapcreator. Import up to 1.000 locations, style your popups, and preview interactions directly in the editor — no code required.
Build maps that move with your data
Upload spreadsheets with up to 1.000 location entries and watch your map take shape instantly. Simply drag and drop an XLSX, XLS, CSV, or TXT file onto the canvas. Mapcreator automatically detects latitude and longitude, placing icons in the right spots. No coordinates? Address data works too. You can even link spreadsheet data directly to map elements like text, colors, or images.
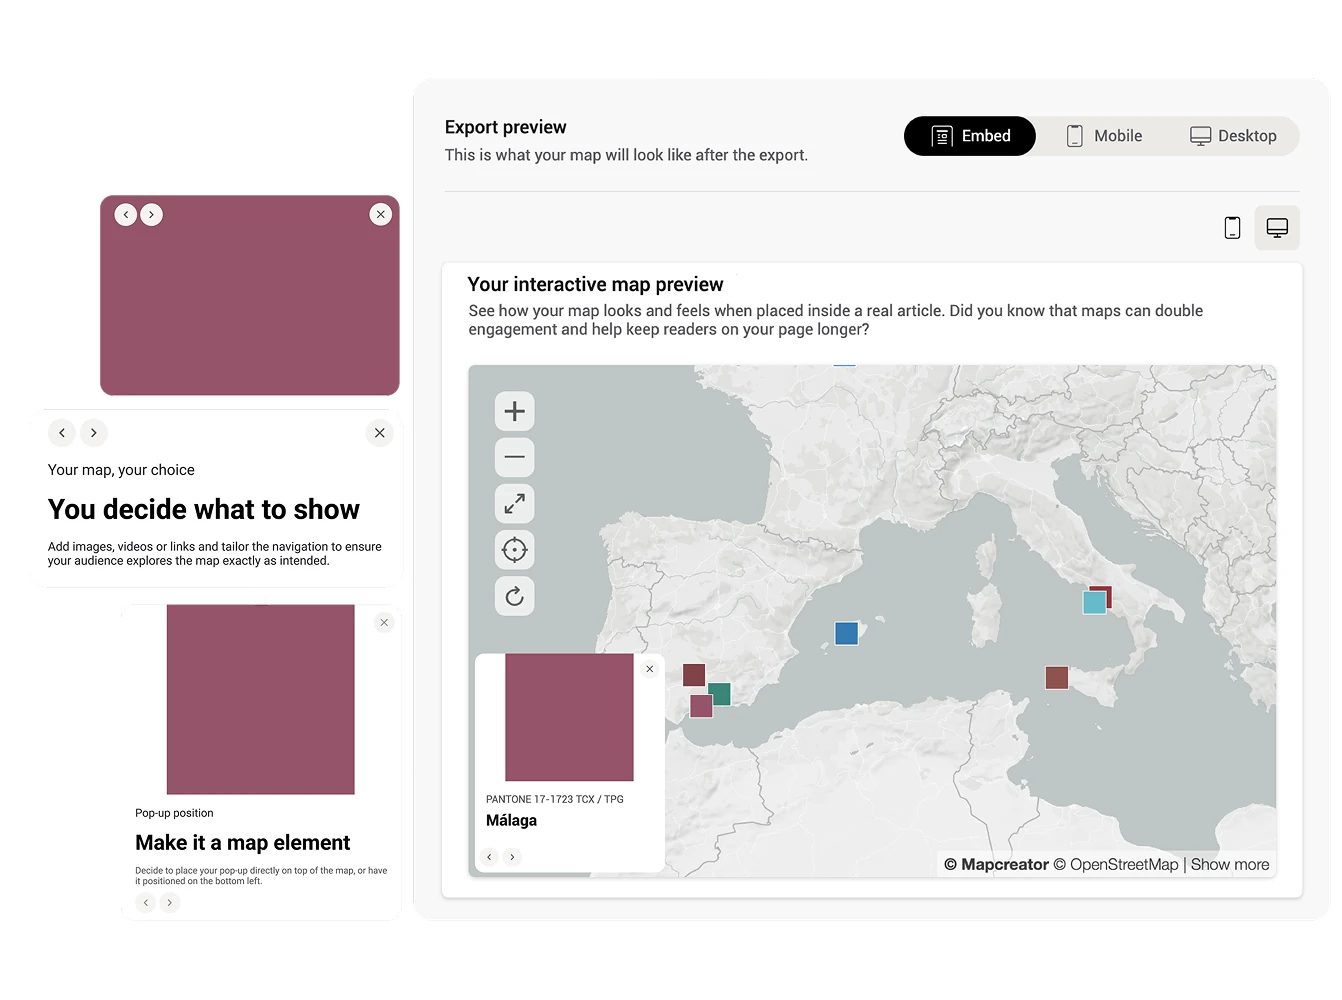
Design and preview your map
Create clean, professional popups with text, images, videos, and links. Preview zoom settings, popup placement, and map behavior directly in the editor — for any device.
Built-in navigation arrows help viewers move smoothly between points, while your map stays responsive and consistent on every screen.
Brand and share easily
Customize map colors, fonts, and icons to match your brand. Share interactive maps via a live URL or embed them directly on your website. Your maps stay consistent, up to date, and easy to share wherever your story lives.
Why teams choose Mapcreator
Turn static data into dynamic stories. Whether you’re visualizing global news, illustrating property data, or tracking real-time events, Mapcreator makes interactive mapping fast, flexible, and intuitive.
Map smarter now.
No spam, just high-quality mapping insights. Unsubscribe anytime.
Frequently asked questions
Got a question? Start with these essential FAQs, or explore our Knowledge Base for more Mapcreator guidance.
Can I create interactive maps without coding?
Yes. You can create interactive maps in Mapcreator without writing code. Import your data, style your map, add popups, preview the experience, and publish it as a live link or website embed.
What kind of data can I use in an interactive map?
You can upload XLSX, XLS, CSV, or TXT files with up to 1,000 location entries. With data binding, you can connect fields from your file to labels, colors, icons, and popups. Popups can also include URLs, images, and YouTube videos. Besides, our live-data integrations also update on your published maps, eliminating manual update tasks.
Can users search inside an interactive map?
Yes. Interactive map exports can include search, so users can quickly find specific locations, properties, points of interest, or data entries. You can also add a geolocation button to help users find their current position on the map.
How do I publish an interactive map on my website?
You can share your interactive map with a live URL or embed it directly on your website. The map stays responsive, so it works across screen sizes and keeps your branding consistent. Any updates to your map will also automatically update on the already published map.