Maps that make the deadline
Mapcreator is an easy-to-use online map tool built on decades of cartographic experience and focused on maps. Create accurate, on-brand newsroom maps in minutes — no GIS or graphic design degree required.







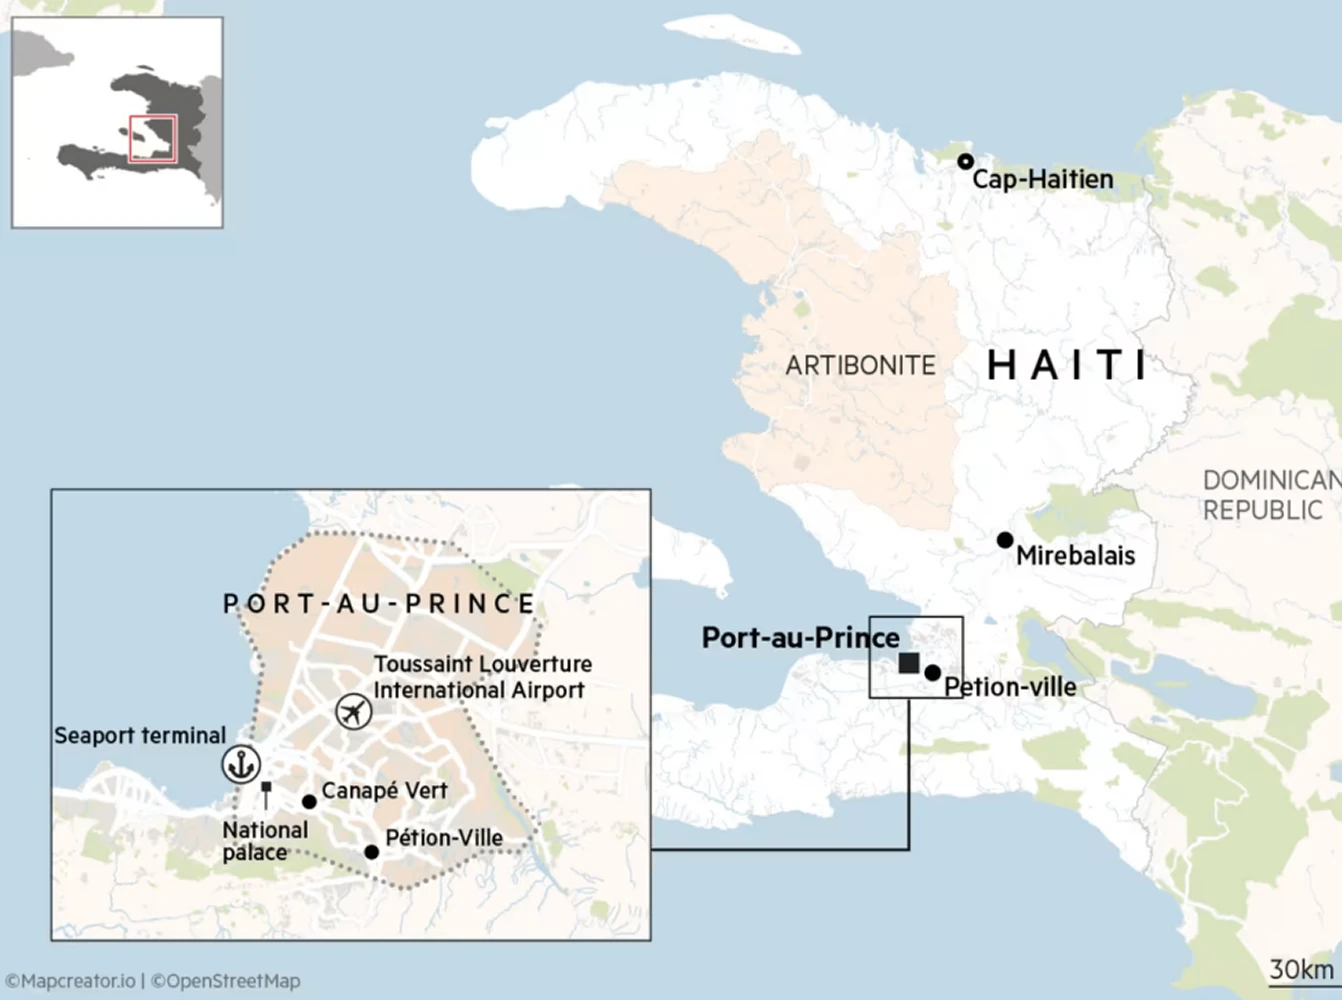
Location: It matters
Built by people who understand maps, Mapcreator delivers ultra-precise, street-level detail and global views with powerful customization, so reporters, editors, and producers can create beautiful, consistent visuals without slowing the newsroom down.
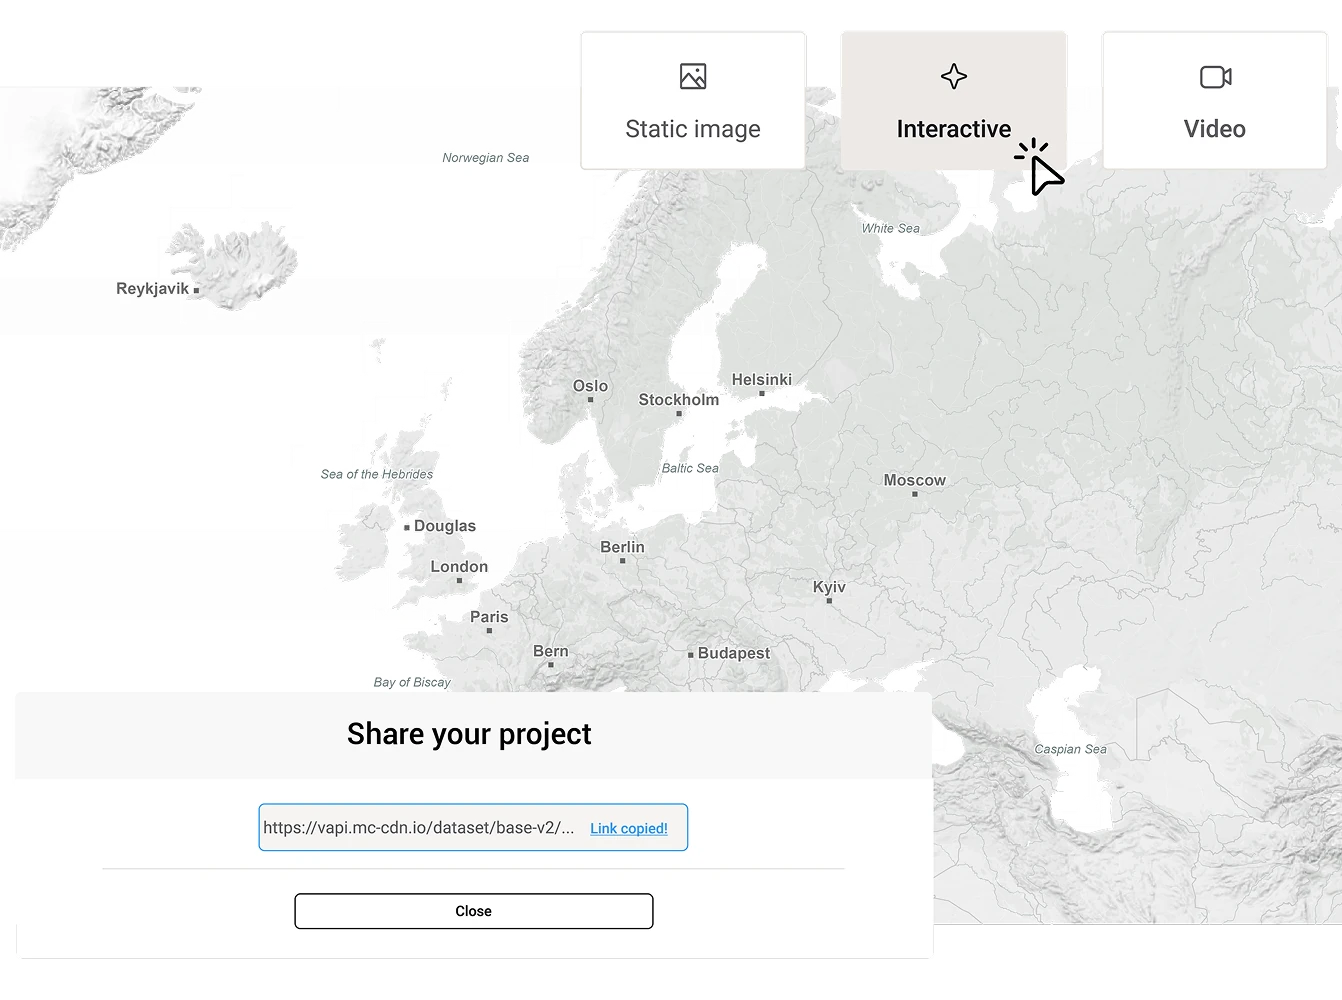
Publish anywhere, anytime
Save and export your maps in the format you need, whether it’s Illustrator-optimized vector formats, video, or web embed code. Share your cross-platform maps for news within a secure team environment for streamlined map project management allowing time-sensitive updates.
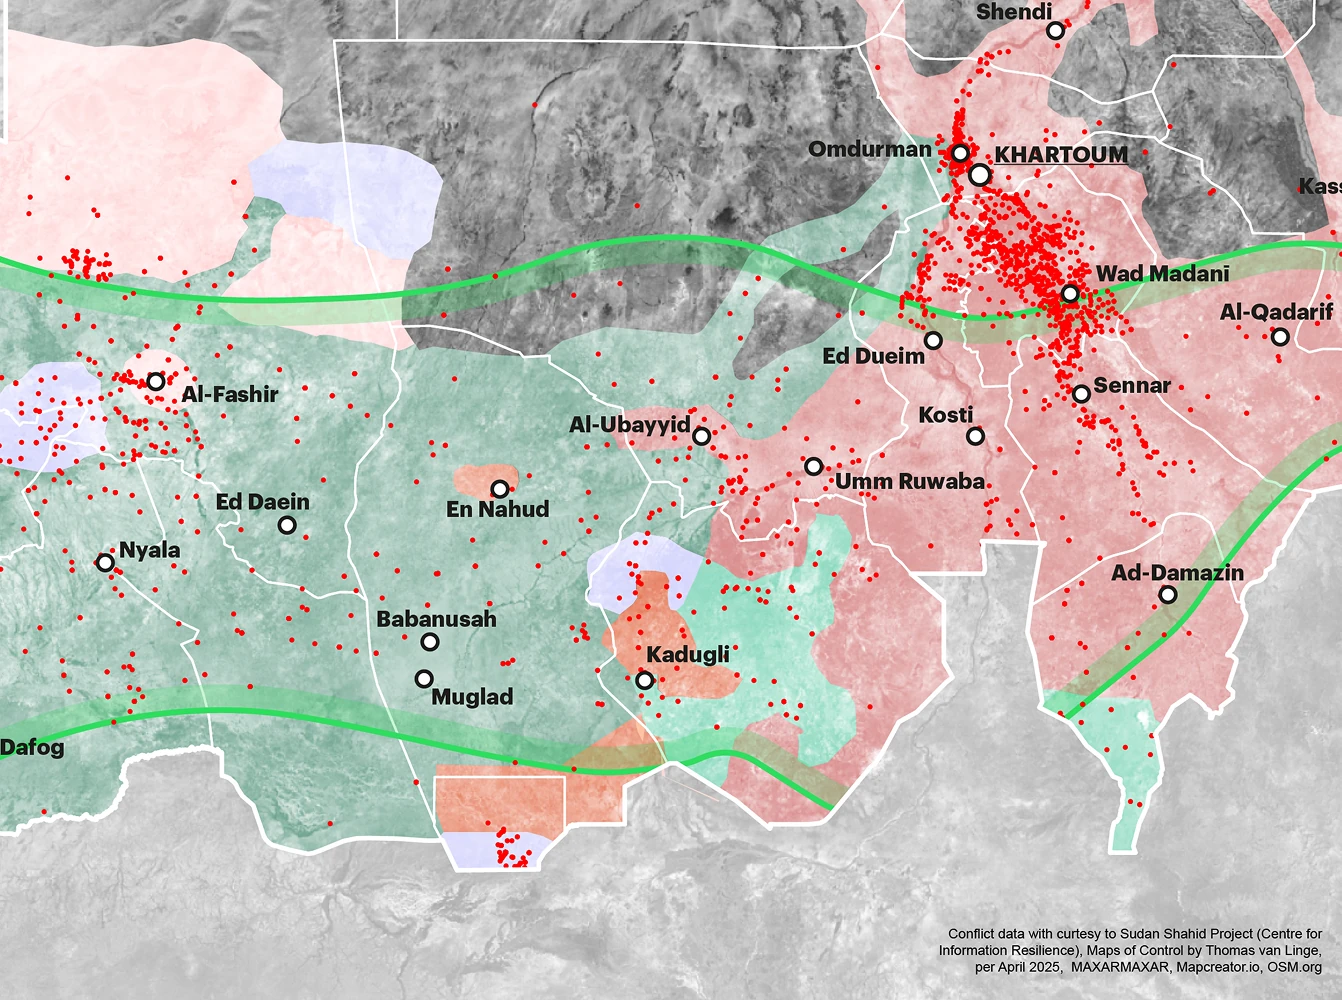
Turn data into stories
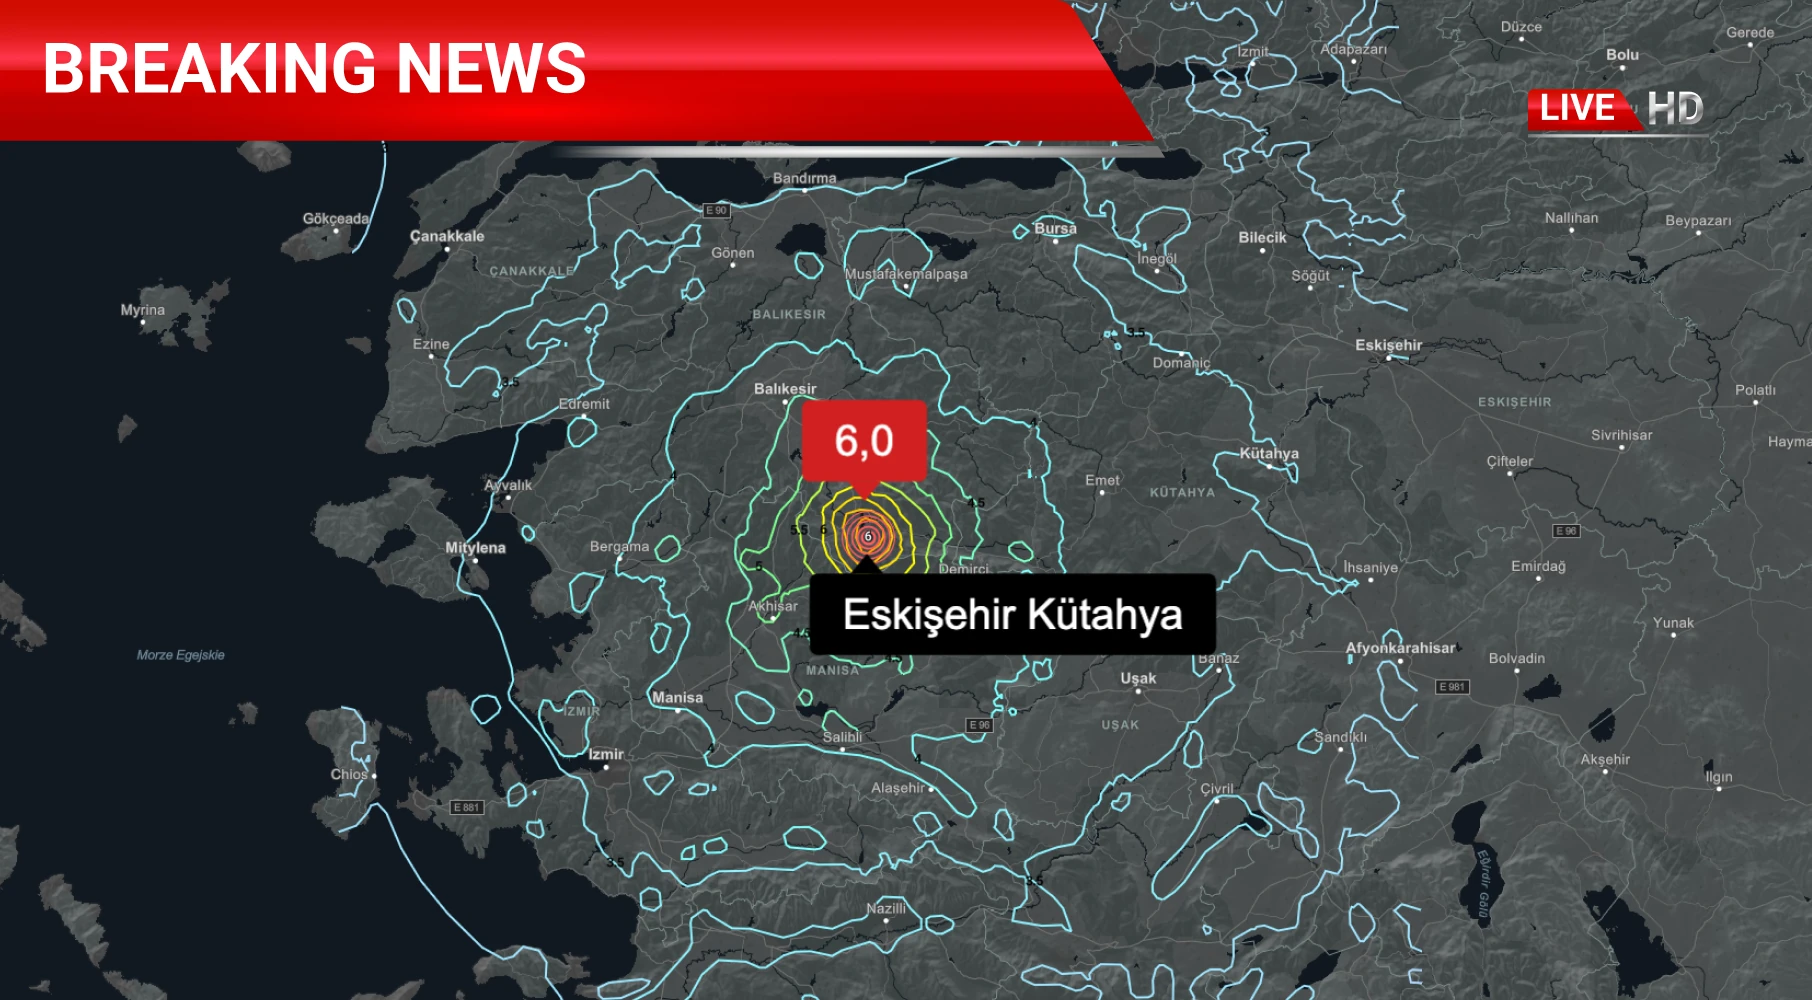
Got a data file with multiple locations? Just drag, drop, and map. Pull in Mapcreator’s live data for breaking stories like earthquakes, hurricanes and wildfires, or integrate your newsroom’s own feeds for one-click visualizations. Your story moves fast. So should your maps.
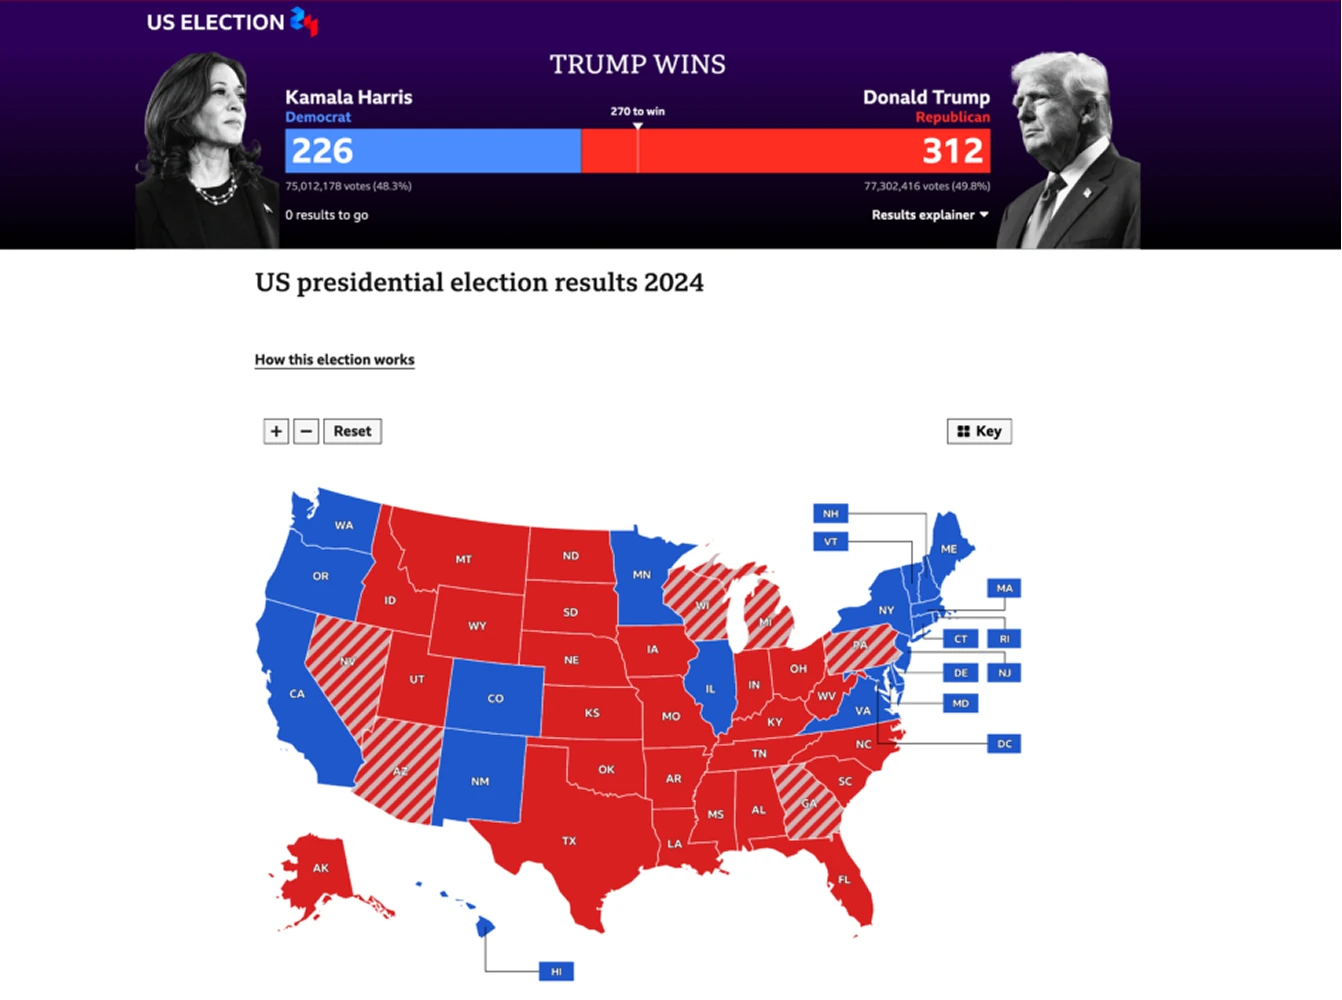
Dynamic election coverage
Connect to reliable data sources or integrate your own feeds to generate constantly updating maps across desktop, mobile, and broadcast.
Work with our team to design exclusive, on-brand election maps that help your newsroom stand out — and stay ahead.
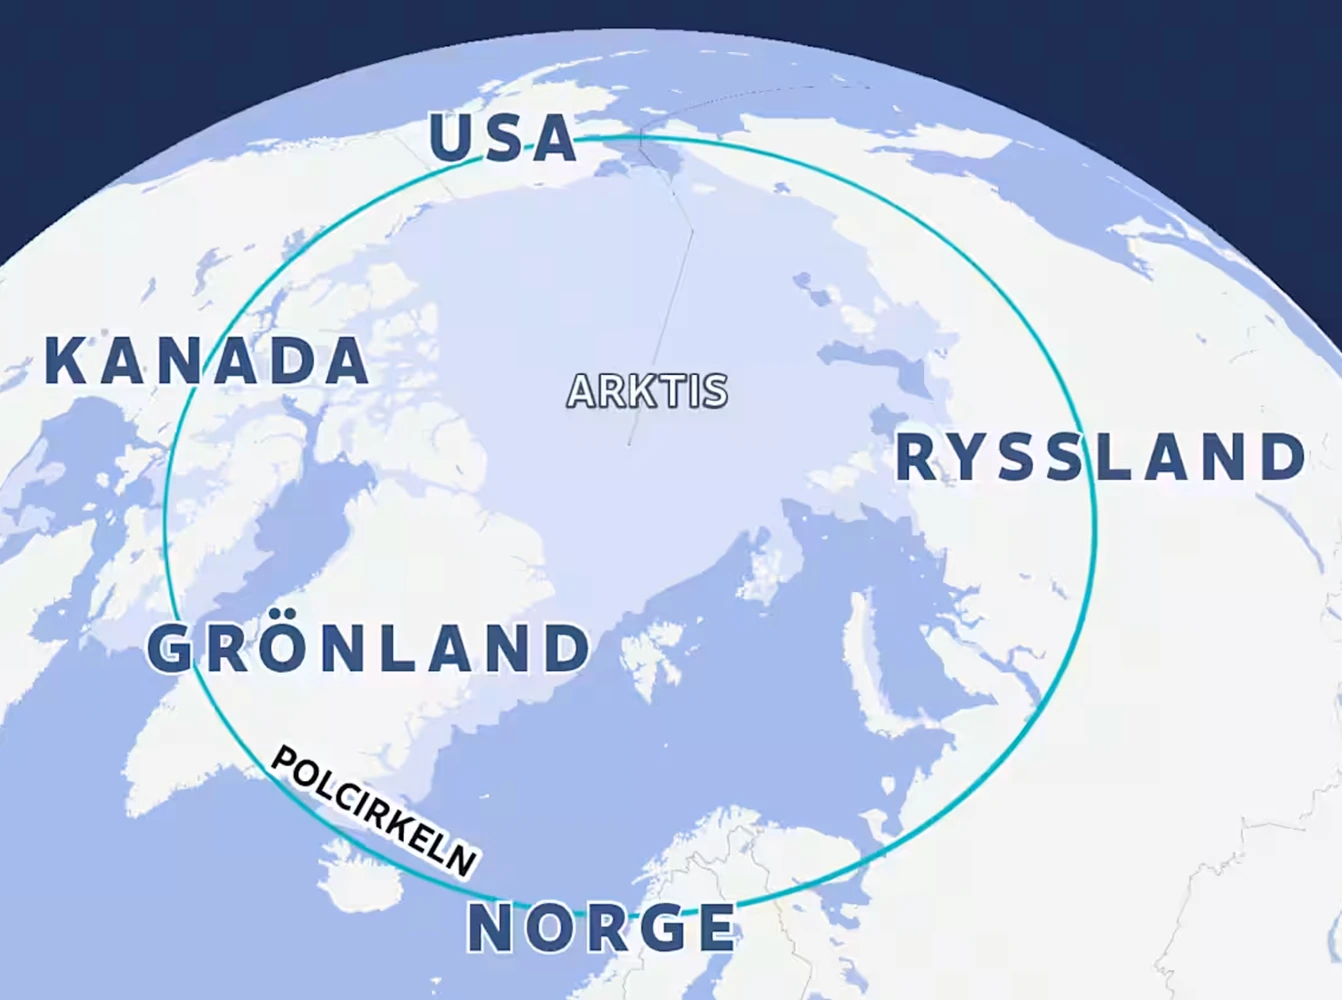
Annotate your maps, your way
Start with a custom basemap tailored to your newsroom’s visual identity. Then add your storytelling layers: markers, labels, routes, polygons, videos, images; even interactive highlights. Everything you need to make your maps as informative (and good-looking) as your headlines. That’s what makes Mapcreator the perfect mapping tool for newsrooms.
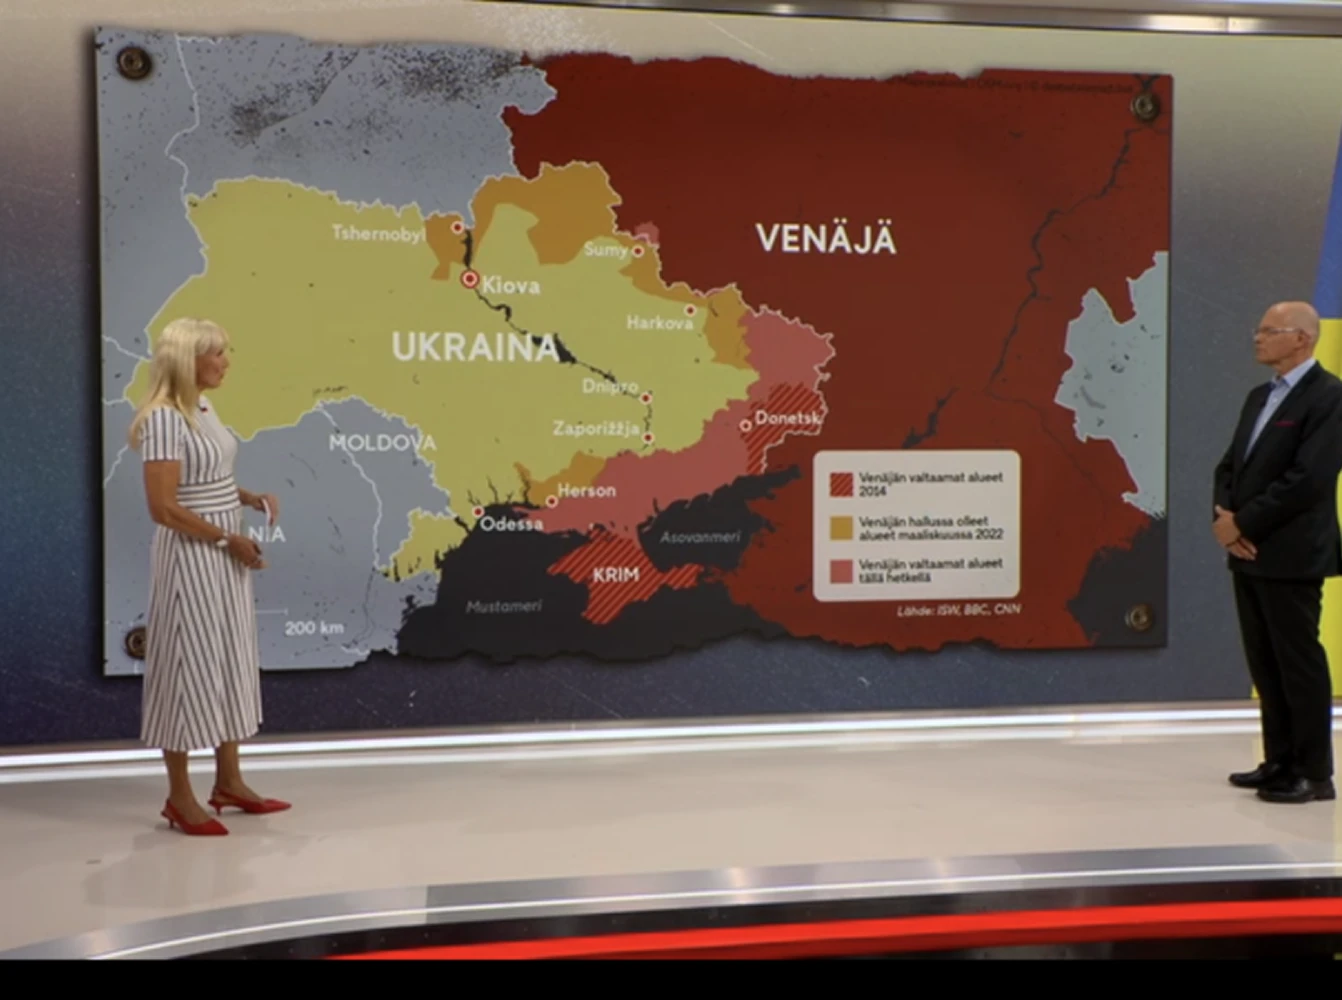
Ready for broadcast
From breaking news to live presentations, with Mapcreator you can deliver broadcast-ready visuals in minutes. Seamlessly create static, interactive, or motion graphics that integrate with your broadcast systems and look great on every screen.
Map smarter now.
No spam, just high-quality mapping insights. Unsubscribe anytime.
Frequently asked questions
Got a question? Start with these essential FAQs, or explore our Knowledge Base for more Mapcreator guidance.
Which Mapcreator plan is best for newsrooms?
The right plan depends on your team size, map types, and level of customization. You can try Mapcreator for free to explore the tool. Enterprise pricing is tailored around users, CMS or NRCS integrations, live data, election maps, and custom map styles. Mapcreator does not charge based on the number of maps created. Get in touch for a custom quote.
Can we manage access for a larger newsroom team?
Yes. Mapcreator can support Single Sign-On through providers such as Okta, allowing organizations to manage users and groups through their existing identity setup. This helps larger newsrooms onboard team members, control workspace access, and apply security policies like multi-factor authentication more easily.
How fast can we create a map for breaking news?
Teams can create quick locator maps in minutes using predefined styles, templates, and export settings. For developing stories, maps can also be updated, reused, or expanded into interactive, animated, or live-data formats as coverage evolves.
Can we use Mapcreator for more than simple locator maps?
Yes. Newsrooms can create static maps, interactive maps, animated maps, live data maps, election maps, and broadcast-ready visuals. This makes Mapcreator useful for breaking news, investigations, explainers, live blogs, digital stories, print graphics, and video coverage.
Mapcreator connect to our existing publishing workflow?
Yes. Mapcreator can integrate with CMS platforms and NRCS workflows, so teams can create and publish maps from within their existing editorial setup. For larger newsrooms, workflows can also include custom styles, live data, elections, and broadcast graphics.