Blog

New feature ✨

Distance rings

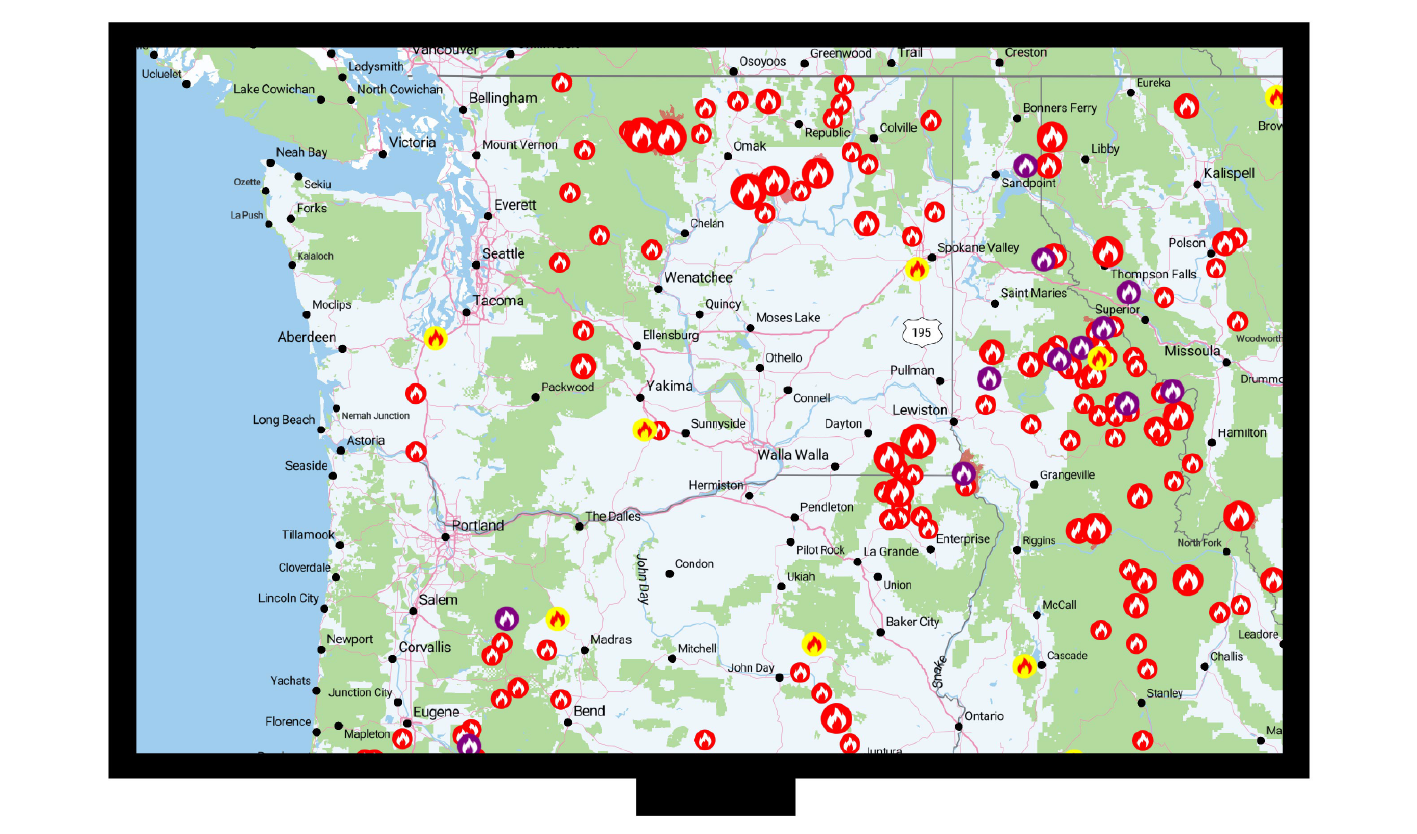
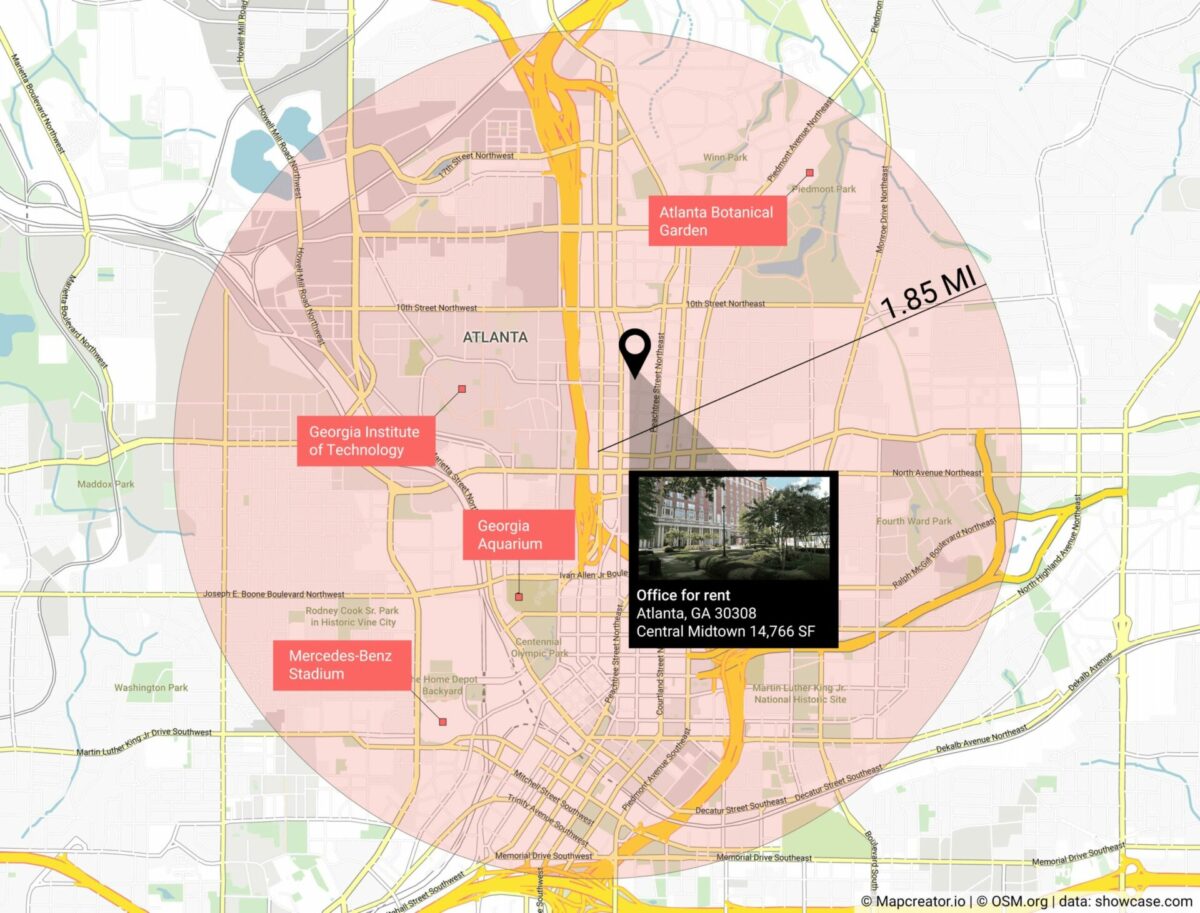
We released our new Distance rings update, which rolls out the ability to draw circles from a center point with a specified distance, either in miles, kilometers, or nautical miles! You’re a commercial realtor – how do you show attractions within a certain distance of your property?   Or you’re reporting government policy and you need […]

Read more
Behind the scenes of a data-driven article and visualization

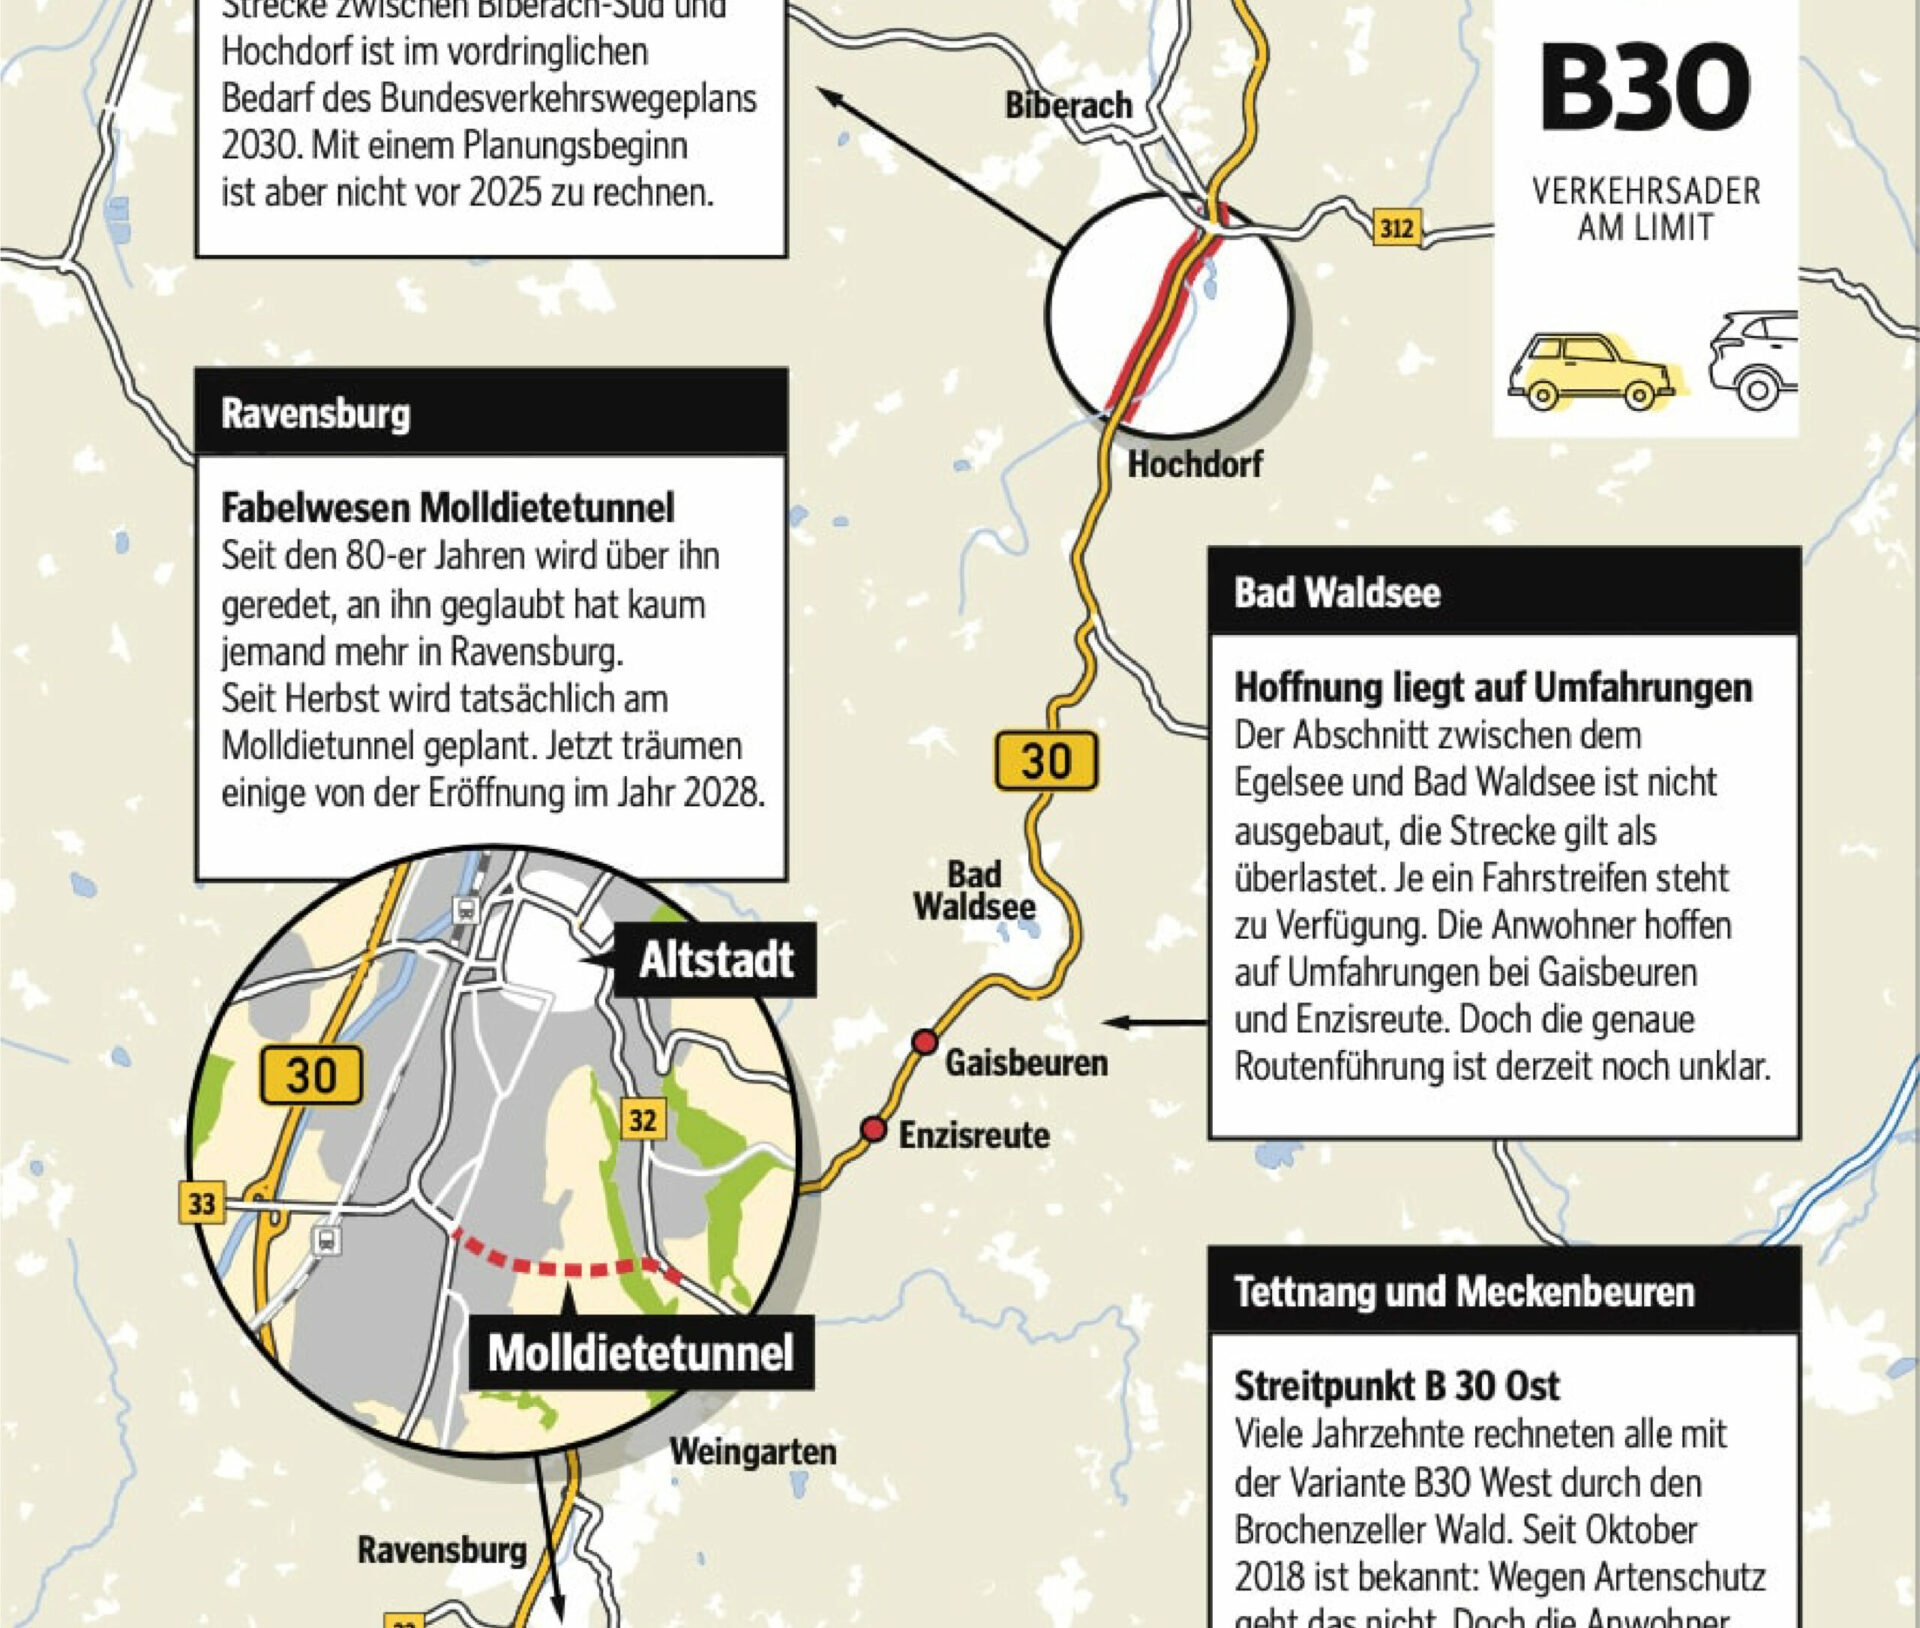
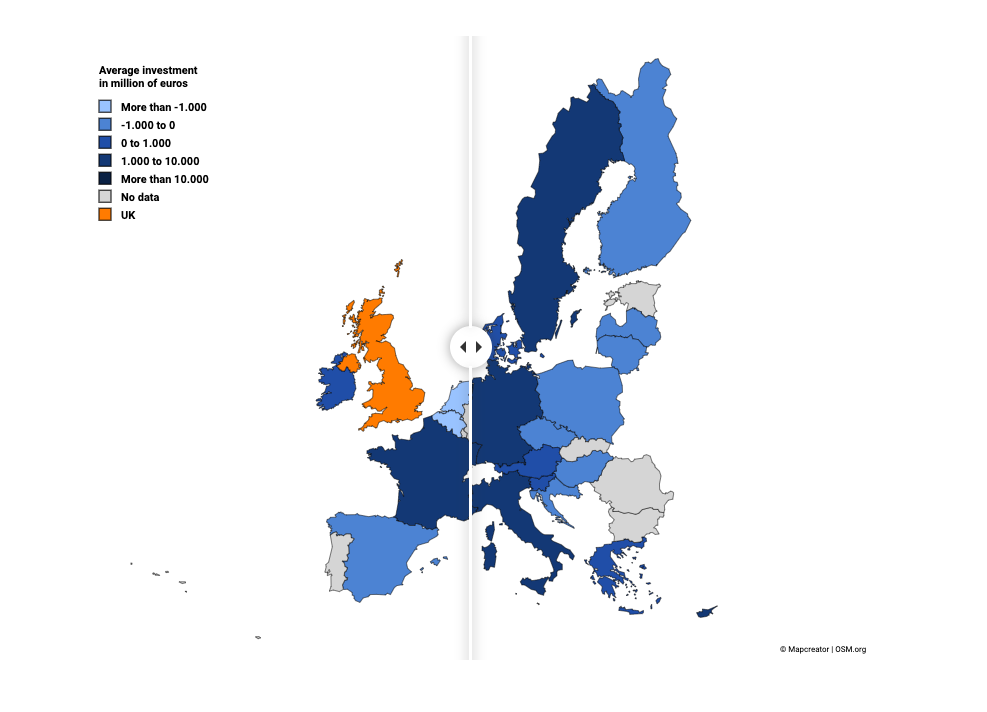
Article by DataBewijst We are DataBewijst: a Dutch data journalism company. The company was founded by four young journalists who have a passion for telling data-driven stories. And what better way to tell a story is there than visualizing it? We wanted to collaborate with Mapcreator because visualizing your data is one of the most […]

Read more

Canadian elections 2021 map

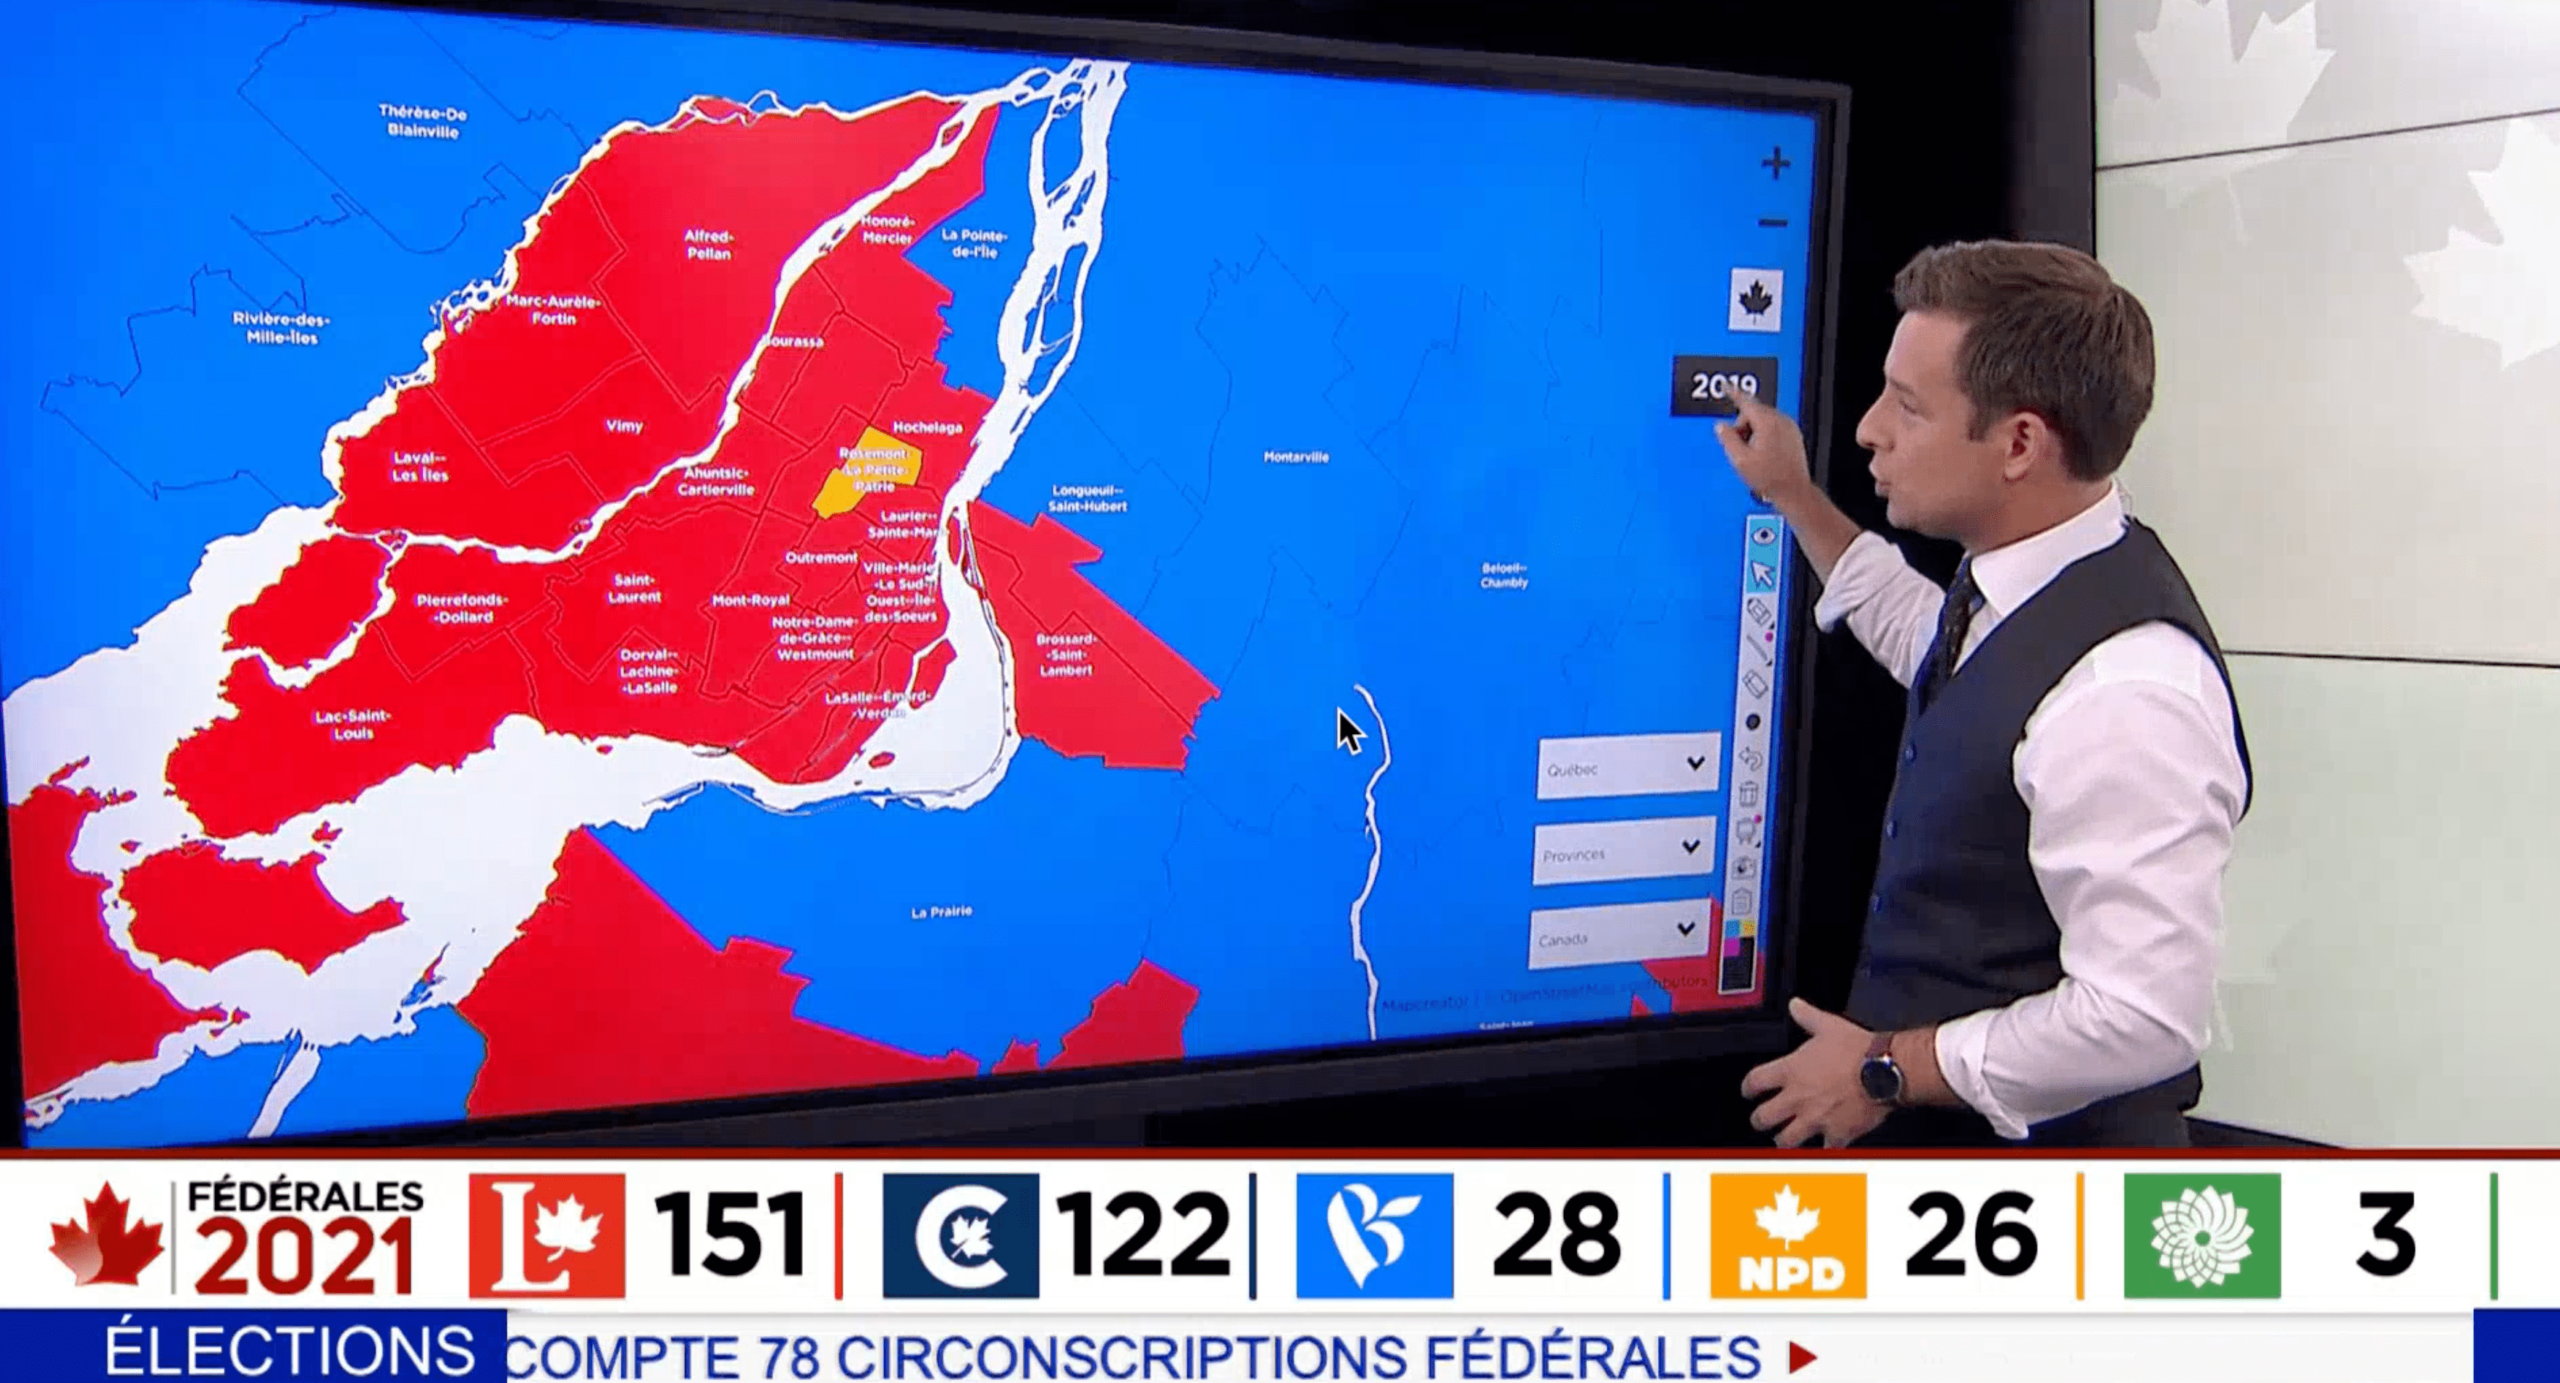
Last week Mapcreator exclusively partnered with Canadian television network TVA. We published live updates on an interactive map which was presented on their news shows. Canada is divided into 338 electoral districts called ridings. Per “first-past-the-post” system, the candidate who receives the most votes per district becomes their Member of Parliament (MP) and represents the riding in the House […]

Read more

GEOlayers compatibility – Maps aren’t static anymore

Today, Mapcreator announces compatibility with the powerful GEOlayers Adobe After Effects extension.  The world loves maps. We see them everyday – in print, online, and on television. For years, mapmakers and cartographers created works of geographic art and visualization as images and interactive dashboards. Mapmaking made a jump from static representations to one that includes […]

Read more

Maps for local news

by Hassân Al Mohtasib If there is only one thing I’ve learned while working for a local/regional newspaper about cartography, it would be this: readers love maps. You can’t afford to be stingy with them. Local newspapers report on those well-known other stories that national broadsheets or even highbrow weeklies don’t. They speak about a […]

Read more

Mapping the U.S. election with live data from Reuters

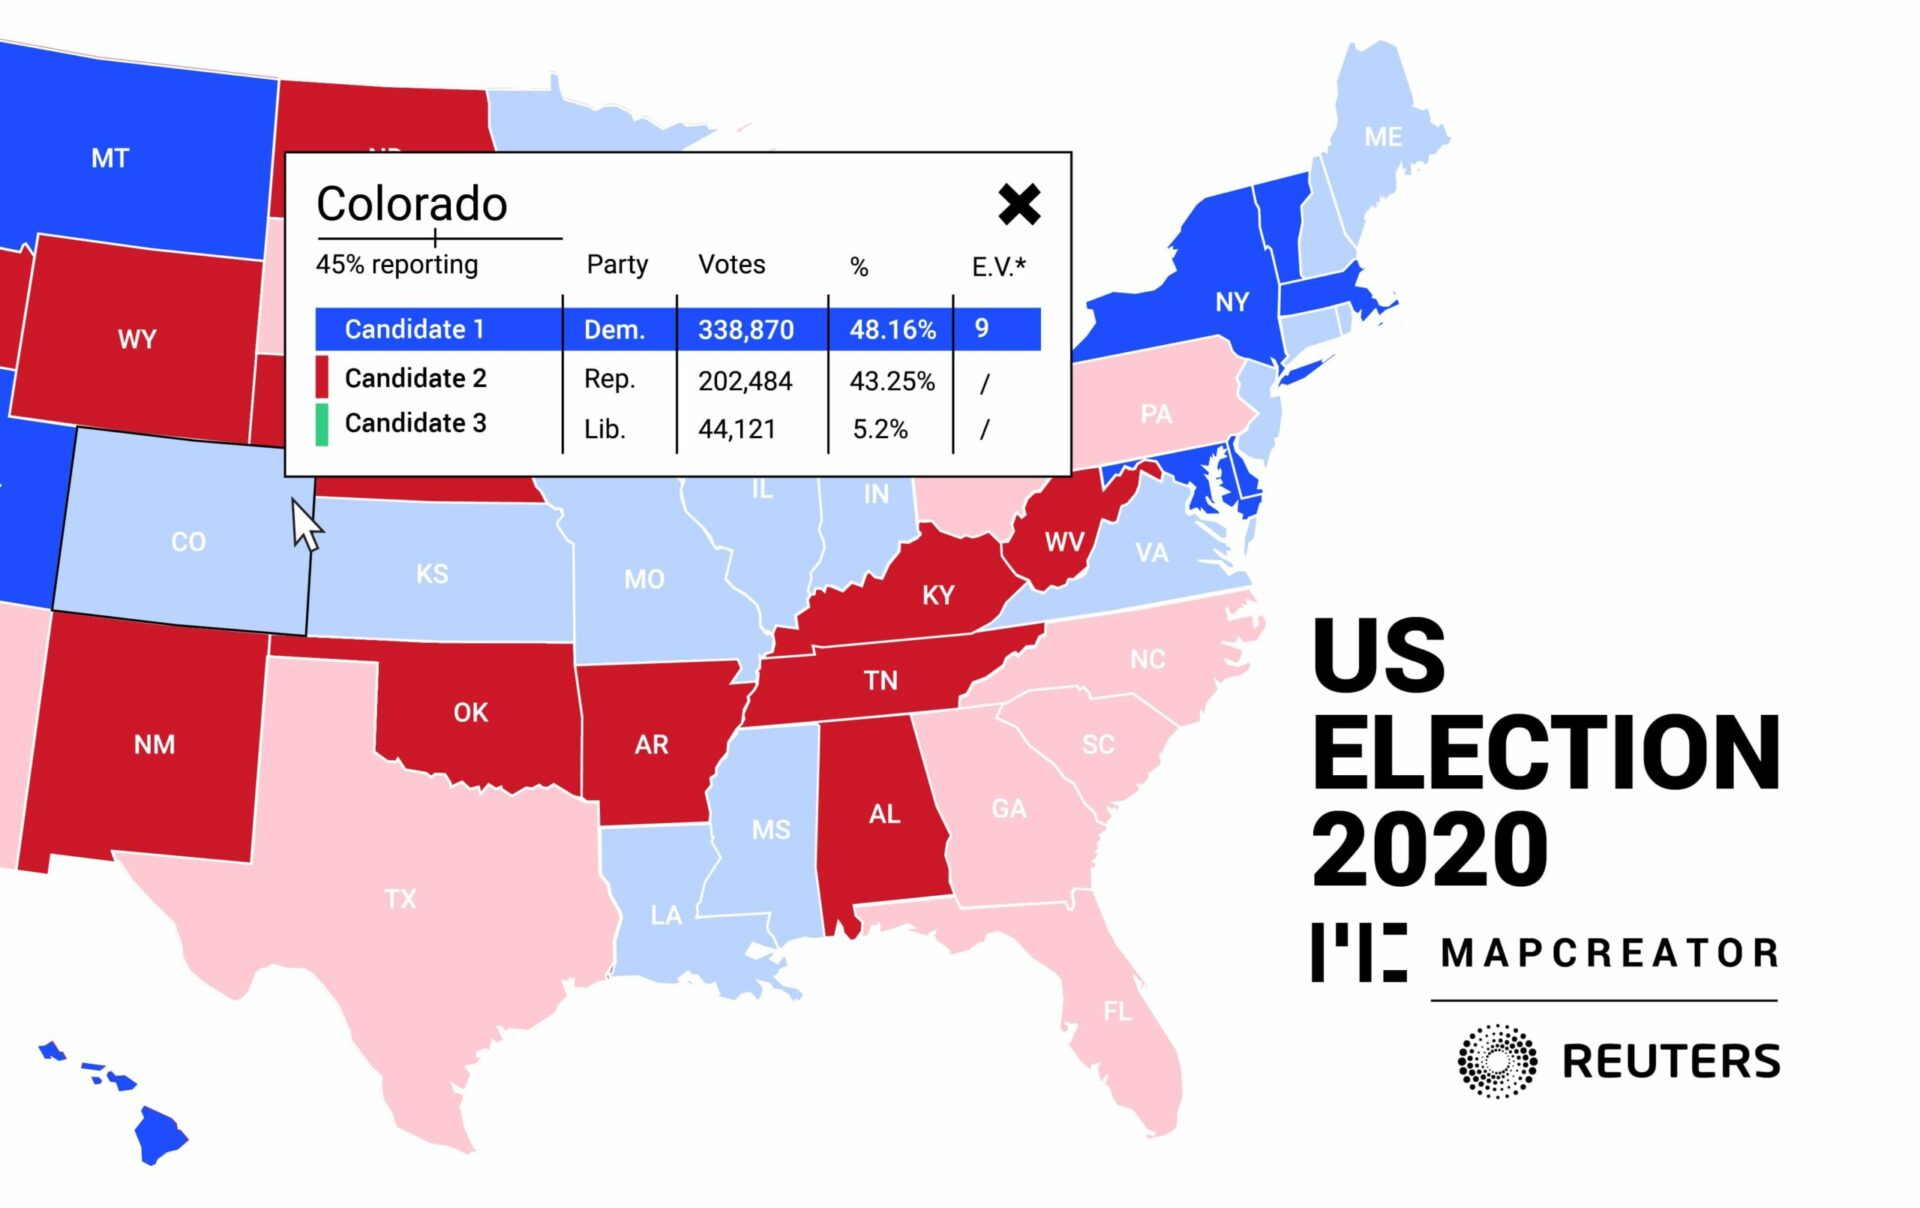
Mapcreator today announced a new partnership with Reuters to allow users of the Mapcreator tool to subscribe to Reuters live U.S. election data feed. The Reuters feed is powered by election data from Edison Research and the National Election Pool (NEP) with the partnership allowing Mapcreator customers around the world to deliver a real-time vote count […]

Read more

Mapcreator: the two-minute map

They say that behind every success is a great team. At Mapcreator, we couldn’t agree more. At the heart of our service is the Mapcreator tool, which enables newsrooms, corporates and brands from around the world to create quality maps, quickly and easily. Technology never stands still; so how do we ensure that the Mapcreator […]

Read more

Mapping impact 

by Frederik Ruys A short guide to visual storytelling With an explosive amount of data and the insatiable need for visualizations it can be hard to find the best tool to share your story. But besides the proper tool, it’s also about the correct approach. How do you map impact with your data in our […]

Read more

This content is available in English

Would you like to switch?

Diese Inhalte gibt's auch auf Deutsch

Möchtest du wechseln?

Contenu disponible en français

Changer de langue ?

Esta página está disponible en español

¿Te gustaría cambiar?

Deze pagina is ook beschikbaar in het Nederlands

Zullen we je doorverwijzen?