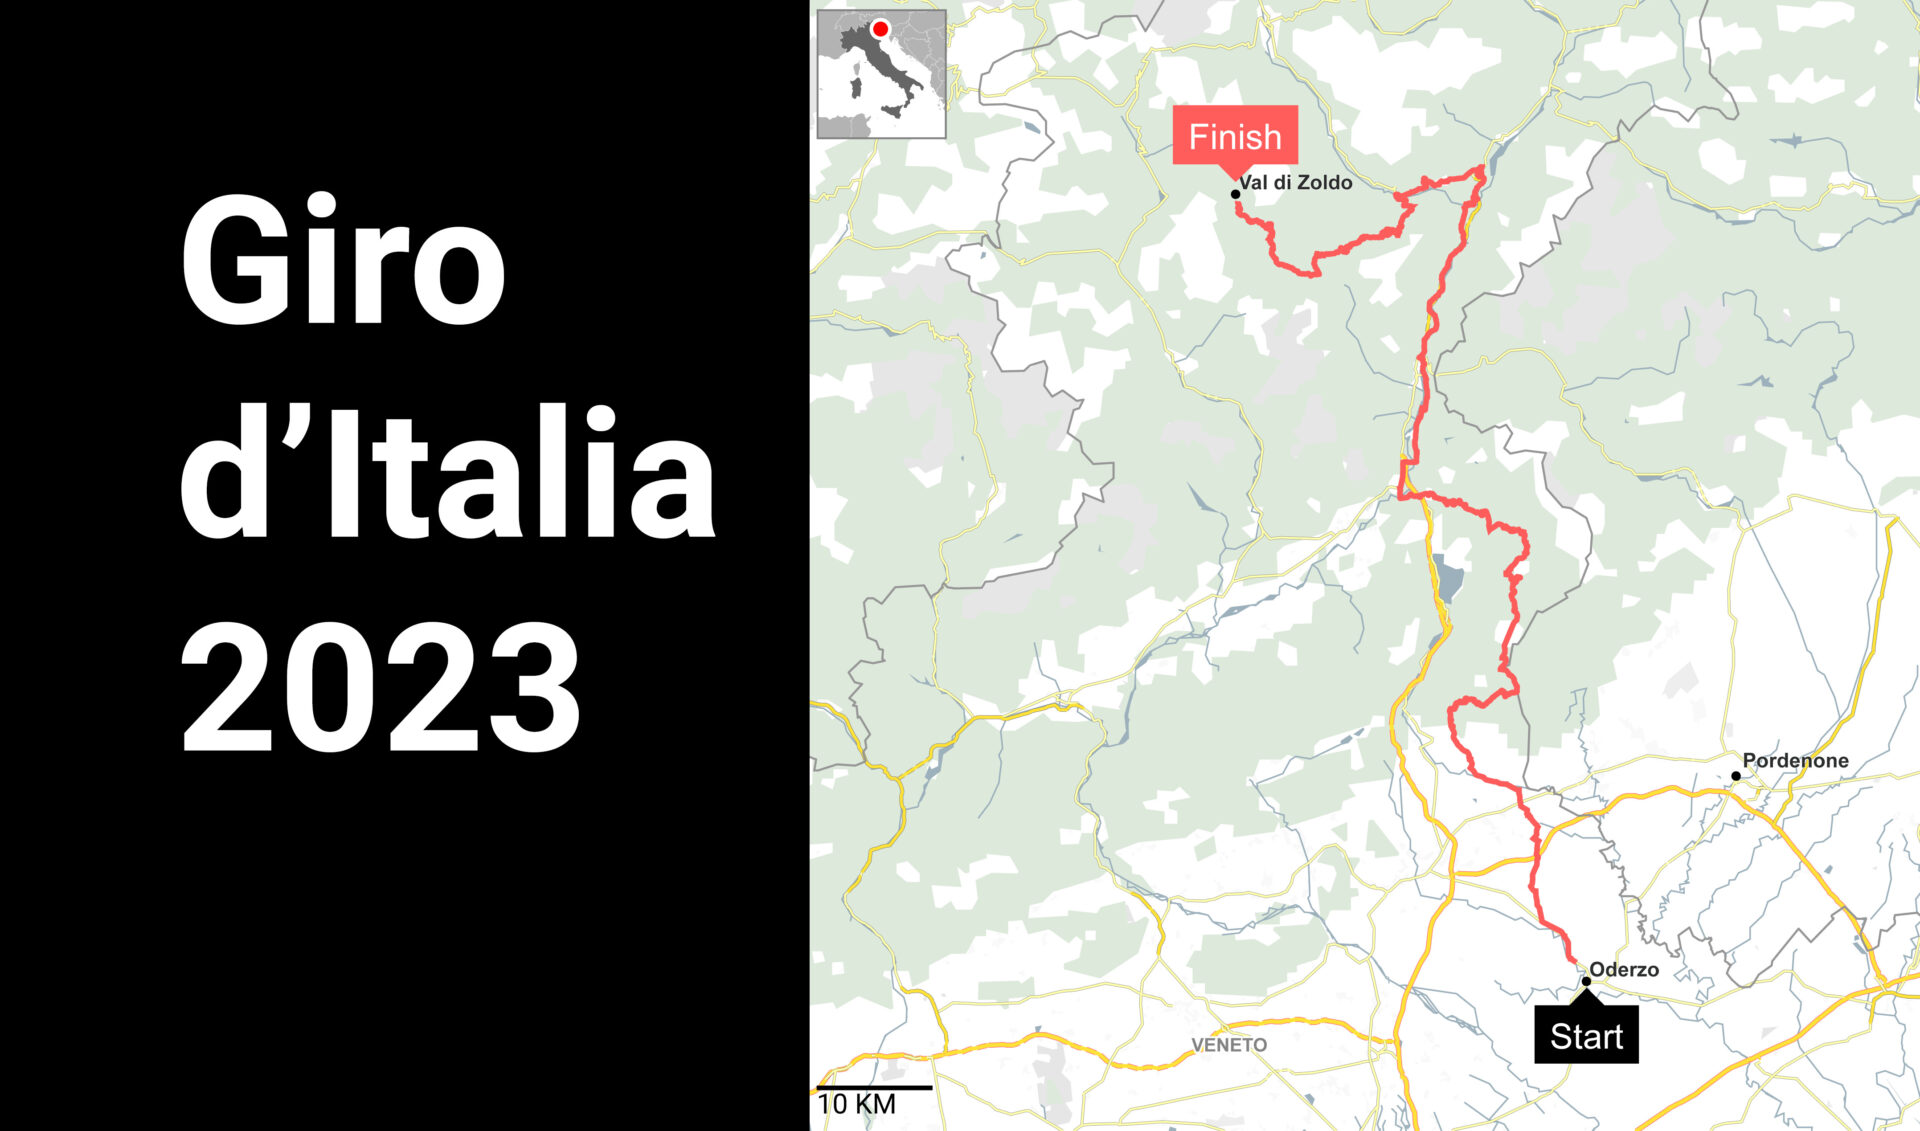
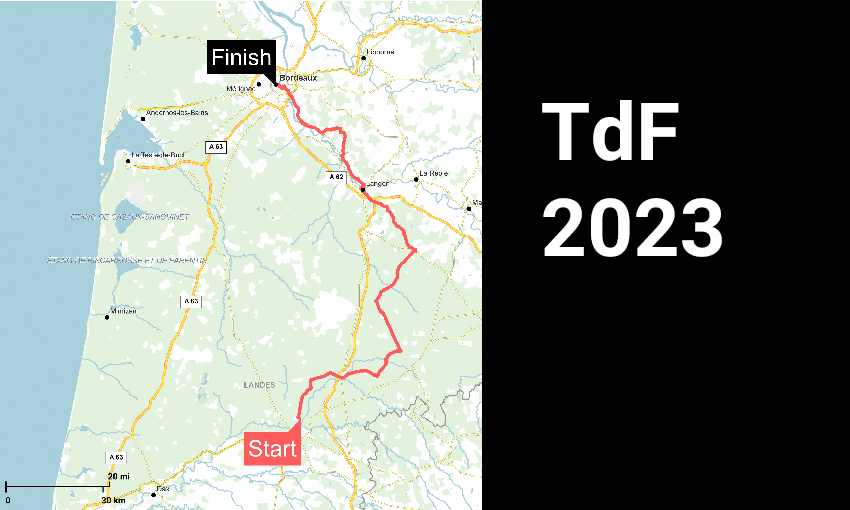
Blog

Explore our tips & tricks to find some extra content to help you unlock the full potential of our tool. Whether you’re looking to enhance your map-making skills or discover hidden features, this page is for you!

New feature ✨

Unlock the power of POI Data Layers and Interactive Legends

Mapcreator mapping tool for business success In today’s fast-paced business world, it’s more important than ever to stay ahead of the competition. One way to do that is by using the latest technology to create customized maps that help your business thrive. POI data layers and interactive legends are essential tools for any business looking […]

Read more

Why Static Maps shouldn’t be forgotten!

With interactivity and animations, you would almost forget the value of static maps. But static maps have been around for centuries and have proven to be a reliable tool for data visualizations, storytelling and simplifying complex geographical information! So despite the advancements in animated, and interactive mapping technologies, static maps continue to play an important […]

Read more

The Giro d’Italia 2023 ready-to-use maps

The Giro d’Italia 2023 is just around the corner and it’s time to start planning your coverage of the race. Whether you’re a cycling enthusiast, broadcaster, sports journalist, news agency or a blogger, having access to accurate and up-to-date information about the race is essential. That’s why we’re thrilled to announce our ready-to-use and customizable […]

Read more

Everything you should know about Vector Files for Mapping!

You might be familiar with JPEG and PNG, but what about Vector files? When it comes to creating static maps, there are several file formats to choose from. While all formats can be used for maps, some consider Vector Files to be the best option for a number of reasons. In this blog, we will […]

Read more

Make an impact with your Mapstyle!

From interactive WEB, static or animated – every project starts with the right mapstyle. In this blogpost we want to guide you through a few of the many mapstyles available in the Mapcreator tool, depending on your projects’ needs. Whether you are looking to add data layers, broadcast your project, have a satellite map or […]

Read more
New feature ✨

Animated routes on your video mapping projects

Are you looking for an easy and quick way to enhance your animated maps? With animated lines or routes in your maps, we’ve got you covered! Whether you want clients to have a digital walk-through around your properties, visualize a flight line between travel locations or make your news article come to life, animated lines […]

Read more
New feature ✨

Customizable Animated Maps for Any Purposes

Did you know that your viewers retain 95% of the information conveyed by a video? To help you take it to the next level, Mapcreator is proud to introduce its latest feature : Animated maps. What is an animated map? Mapcreator – your easy to use online mapping tool now allows you to turn static […]

Read more

How To Create an Interactive Map | No Other Guide Needed

If you are impressed with advanced interactive maps but think that’s not something you can do on your own… hold on! You CAN create interactive maps right now, with no coding skills, no previous experience, and no help from professionals. Interactive maps are one of the most popular ways of representing data visually. And that’s […]

Read more

Visualize your story with satellite imagery from HERE Technologies

Mapcreator provides a full global base map to our subscribers. Visualize and create maps anywhere in the world with high resolution photorealistic quality. Satellite imagery Mapcreator uses global satellite and aerial imagery provided by HERE Technologies. HERE provides Mapcreator some of the sharpest and up-to-date imagery through a strategic partnership with Maxar. The imagery is […]

Read more
New feature ✨

Distance rings

We released our new Distance rings update, which rolls out the ability to draw circles from a center point with a specified distance, either in miles, kilometers, or nautical miles! You’re a commercial realtor – how do you show attractions within a certain distance of your property?   Or you’re reporting government policy and you need […]

Read more

Behind the scenes of a data-driven article and visualization

Article by DataBewijst We are DataBewijst: a Dutch data journalism company. The company was founded by four young journalists who have a passion for telling data-driven stories. And what better way to tell a story is there than visualizing it? We wanted to collaborate with Mapcreator because visualizing your data is one of the most […]

Read more

Baking the map layer cake

by Maarten Lambrechts Almost all mapmaking tools with a graphical user interface use map layers to manage the content of the map. The source of the layers can be very diverse: they can come from the local computer or from a remote source, they can contain raster sources or vector source layers. But every layer […]

Read more

How to make your map stand out from the pack

Using data visualization in your stories can provide a more efficient and coherent way to present information to readers. Maps are one of the most popular ways to do this, especially when it comes to geographical data. Creating a map for your news story has never been easier. But how your map looks is be […]

Read more

How modern technology changed cartography forever

Almost everything becomes digitized these days, creating maps is no exception. Drawing out roads, railways and even complete cities by hand, is not necessary anymore. Mapping has changed, so cartographers have to change as well. But how?

Read more

This content is available in English

Would you like to switch?

Diese Inhalte gibt's auch auf Deutsch

Möchtest du wechseln?

Contenu disponible en français

Changer de langue ?

Esta página está disponible en español

¿Te gustaría cambiar?

Deze pagina is ook beschikbaar in het Nederlands

Zullen we je doorverwijzen?