Visualización de datos
Visualización de datos
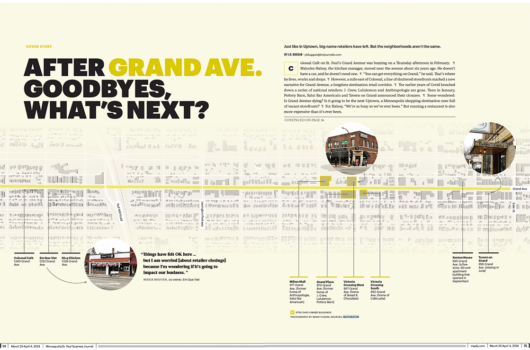

ACBJ – Business along Grand Ave
Map from ACBJ showing the various businesses along Grand Ave. and their future, worries, and plans, in Minnesota.
Learn more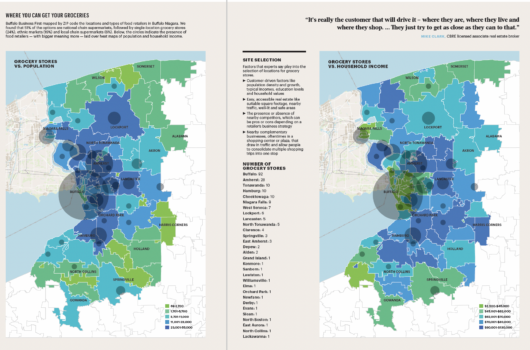

ACBJ – Food retailers in Buffalo Niagara
A map visualizing where inhabitants of Buffalo Niagara can get their groceries. This data visualization has been marked with green and blue colors, showing the division of population versus groceries stores per district and household income versus grocery stores per district.
Learn more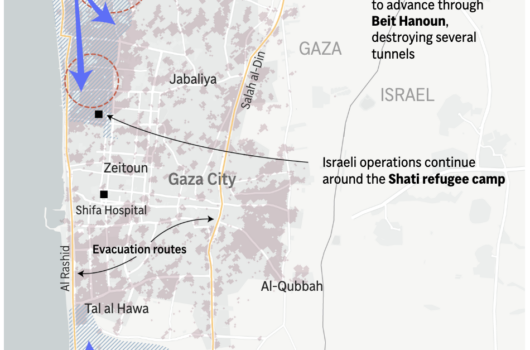
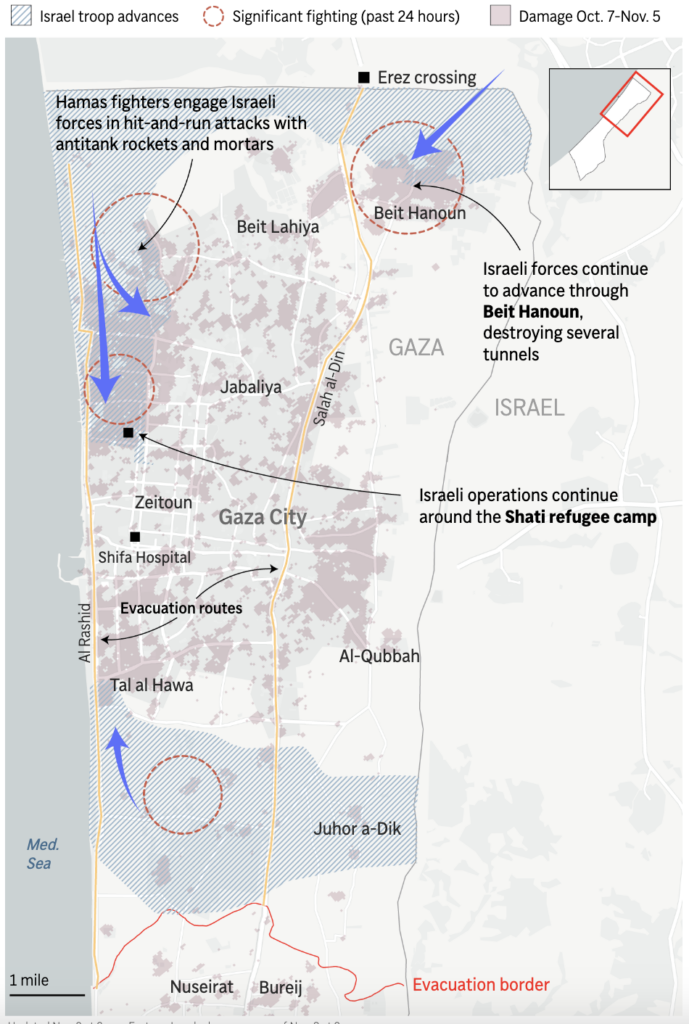
Associated Press – Israeli military forces inside Gaza
This geographically detailed map offers insights into the conflict involving Israeli forces and Hamas fighters. It covers multiple locations, such as Gaza City, Beit Hanoun, Zeitoun, and Jabaliya.
Learn moreInternational Crisis Group – Battleground dynamics
This map illustrates the distribution of violent events related to Turkey's PKK conflict between 2016 and 2022 across Turkey and its neighboring countries. Presented against a white background with outlined country boundaries, the map features numerous scattered dots throughout the region, with each dot symbolizing a specific violent event.
Learn more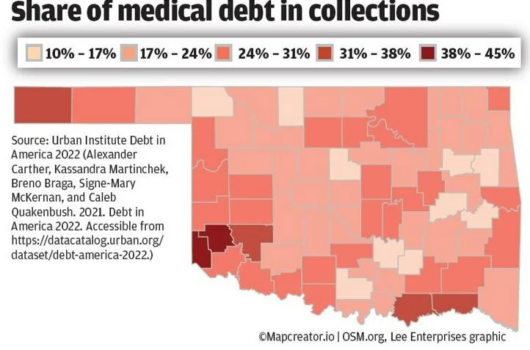
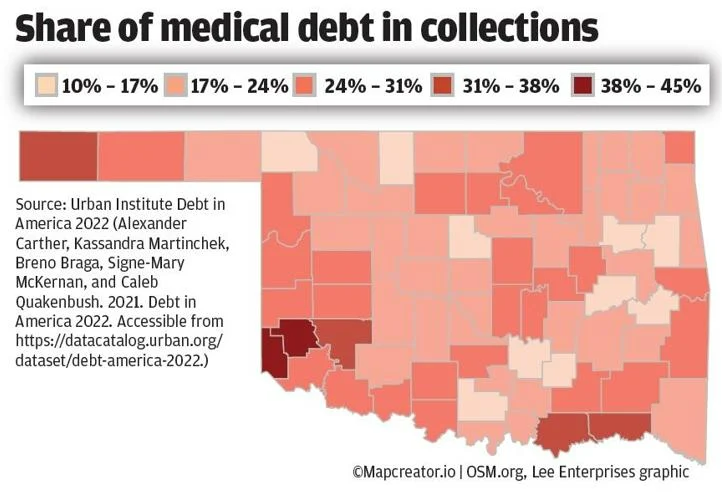
Lee Enterprises – Share of medial debt
This choropleth color-coded map of Oklahoma showcases the percentage of medical debt in collections across the state's counties. Different shades of red are utilized to emphasize varying levels of medical debt, where darker shades correspond to higher percentages and lighter shades indicate lower percentages.
Learn more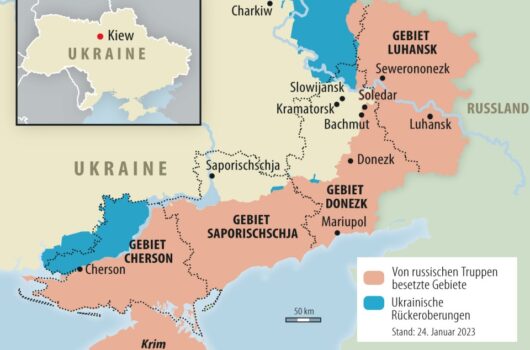
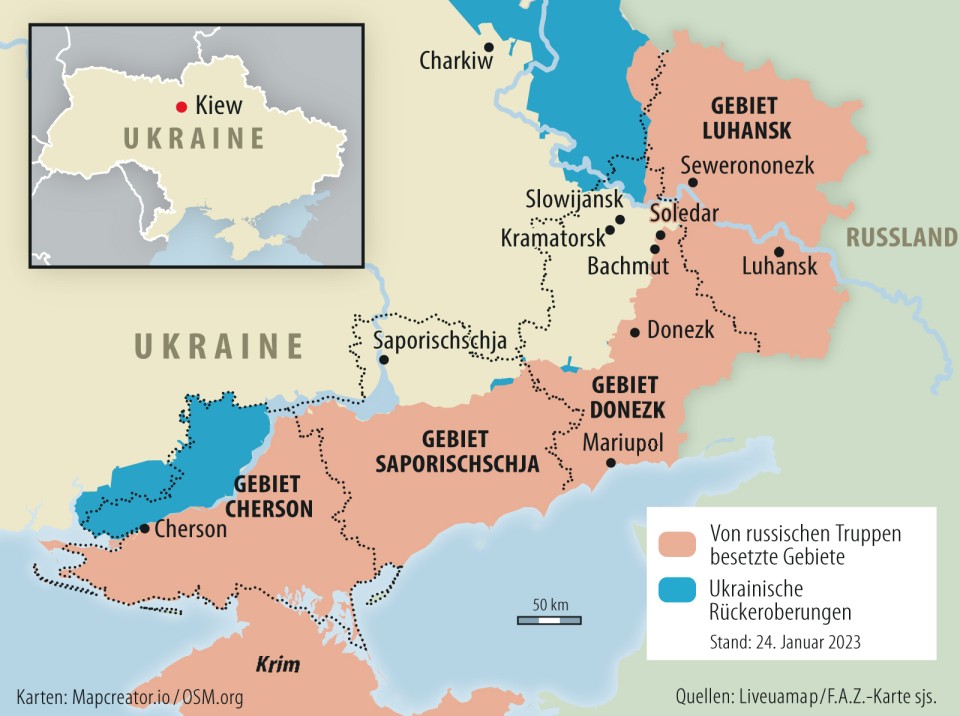
Frankfurter Allgemeine Zeitung – January status of Russian Ukrainian War
The image presents a divided map of Ukraine with various regions and cities highlighted. On the top left corner of the image, there's an inset map showing the location of Kiew. Labels have been added to the map for various locations including Luhansk, Donezk, Mariupol and Cherson.
Learn more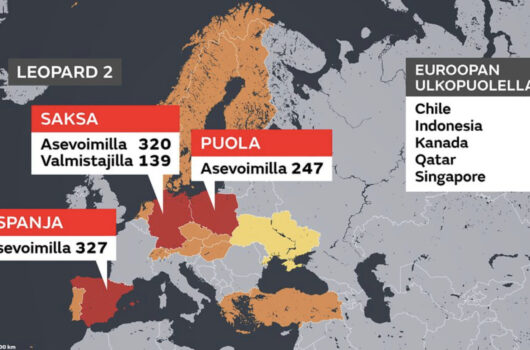
MTV Oy – Tank deliveries in the Russian Ukrainian war
This image is a choropleth map highlighting various countries in Europe. Labels are added to show the number of Leopard 2 tanks in the forces, from Germany (320 forces and 139 manufacturers), Poland (247 forces) and Spain (327 forces). From this map we can conclude that the darker the color of the country, the higher the number of Leopard 2 tanks.
Learn more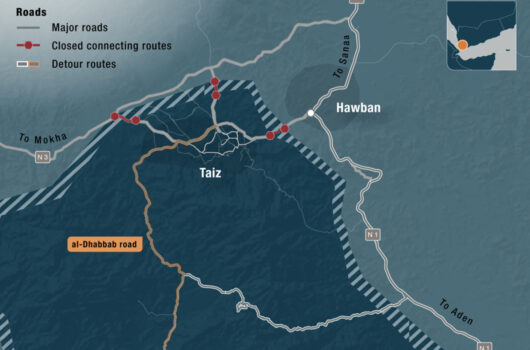
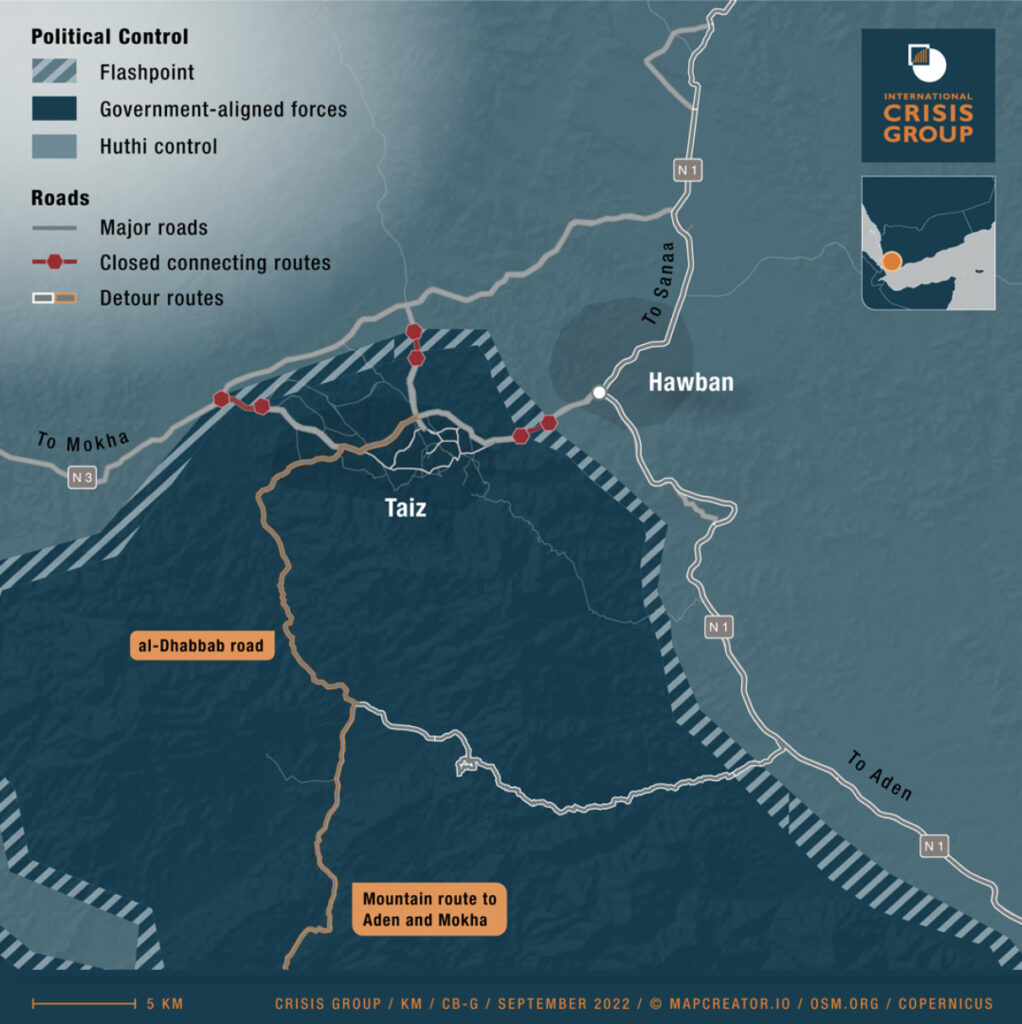
International Crisis Group – Yemen Territorial Control
This image is a map visualizing the Yemen Territorial Control in 2022. Major roads have been marked as well as closed connecting roads and detour routes, and areas of control by different groups.
Learn more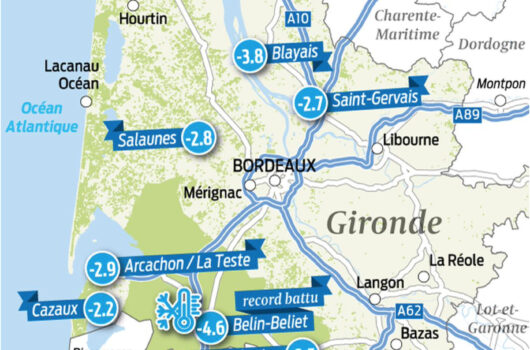
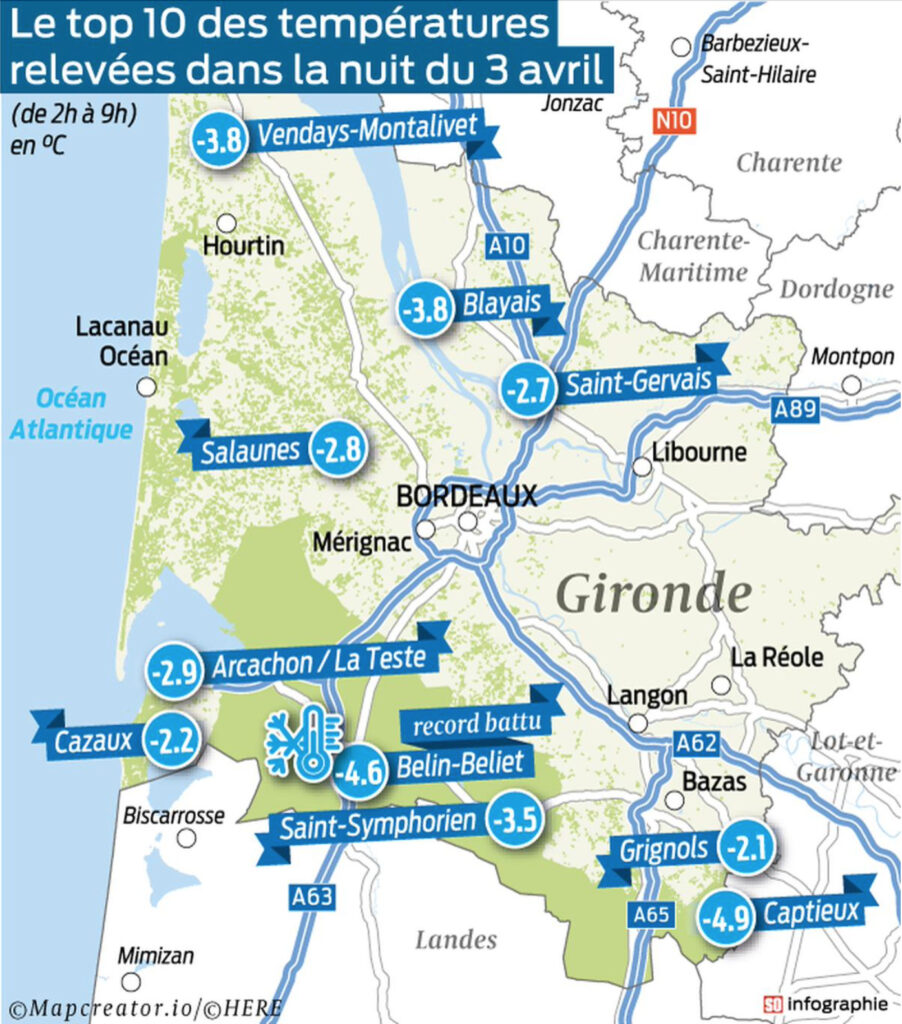
Sud Ouest – Cold wave in Gironde
This image is a map of the area of Gironde in France. On top of the map, there is a description added explaining that we are looking at the top 10 coldest temperatures reported in the area on the night of April 3rd, (between 2am. and 9am in celsius).
Learn more